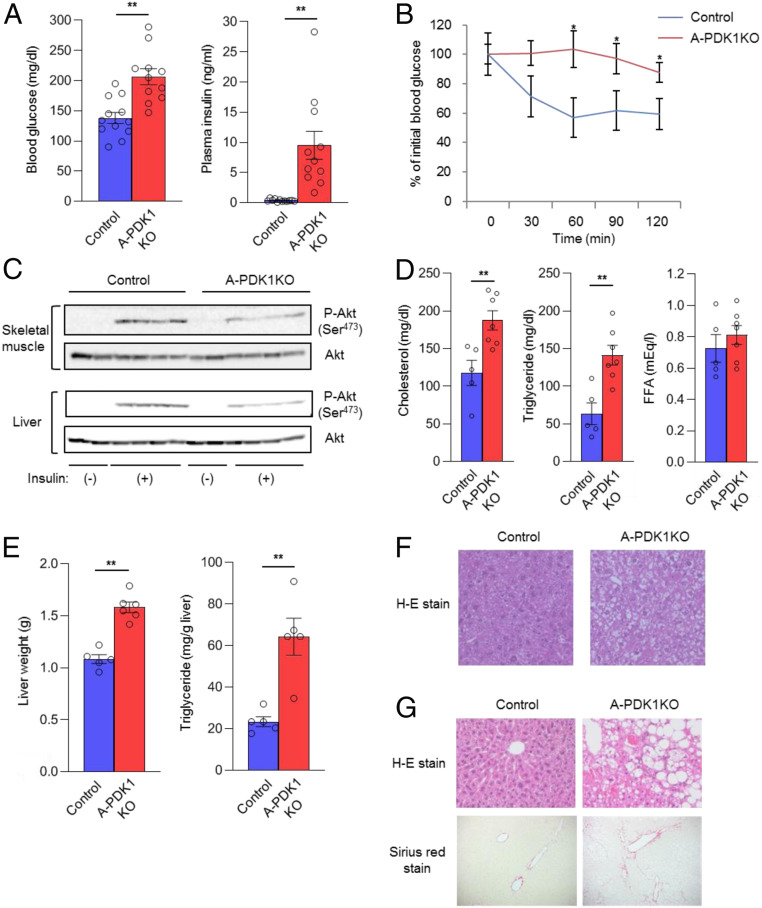
Fig. 2.
Systemic insulin resistance and metabolic abnormalities in A-PDK1KO mice. (A) Blood glucose and plasma insulin concentrations for control or A-PDK1KO mice (n = 11 or 12) in the randomly fed state. (B) Insulin tolerance test for control or A-PDK1KO mice (n = 7 or 8). (C) Immunoblot analysis of total and Ser473-phosphorylated forms of Akt in liver and skeletal muscle isolated from control or A-PDK1KO mice at 10 min after i.p. injection of insulin (5 U/kg) or vehicle. (D) Plasma cholesterol, triglyceride, and FFA concentrations in control or A-PDK1KO mice (n = 5 to 7). (E) Weight and triglyceride content of the liver from control or A-PDK1KO mice (n = 5 or 6). (F) H&E staining of liver sections from 11-wk-old control or A-PDK1KO mice. (Original magnification: 200×.) (G) H&E (Upper) and Sirius red (Lower) staining of liver sections from 35- to 37-wk-old control or A-PDK1KO mice. (Original magnification: 200×.) All quantitative data are means ± SEM; *P < 0.05, **P < 0.01 for the indicated comparisons or versus corresponding control value (Student’s t test).

