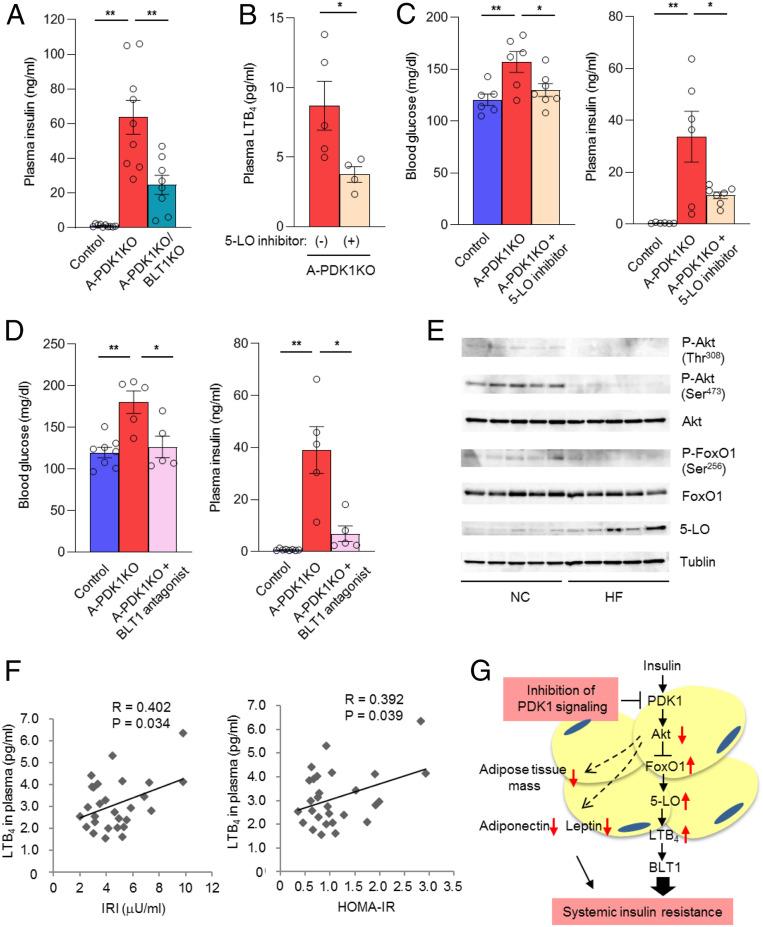
Fig. 6.
The 5-LO–LTB4 axis is associated with systemic insulin resistance in both mice and humans. (A) Plasma insulin concentrations for control, A-PDK1KO mice, and A-PDK1KO/BLT1KO mice (n = 8 to 10) in the randomly fed state at 24 wk of age. (B) Plasma LTB4 concentration in female A-PDK1KO mice (n = 4 or 5) treated with the 5-LO inhibitor zileuton for 2 wk. (C) Blood glucose and plasma insulin concentrations in control or A-PDK1KO mice (n = 6 or 7) treated (or not) with zileuton for 7 wk. (D) Blood glucose and plasma insulin concentrations in control or A-PDK1KO mice (n = 5 to 8) treated (or not) with the BLT1 antagonist CP-105696 for 5 wk. Quantitative data in A–D are means ± SEM; *P < 0.05, **P < 0.01. (E) Immunoblot analysis of total and Thr308 or Ser473-phosphorylated forms of Akt, total, and Ser256-phosphorylated forms of FoxO1, 5-LO, and tublin in epididymal adipose tissue of mice fed a normal chow (NC) or a high-fat diet (HF) at 1 h after refeeding. (F) Correlation between plasma LTB4 concentration and either serum immunoreactive insulin (IRI) concentration or HOMA-IR in human subjects (n = 28). R, Pearson’s correlation coefficient. (G) Model for the regulation of systemic insulin sensitivity by insulin–PDK1 signaling in adipocytes. Red arrows indicate effects of PDK1 ablation in adipocytes.

