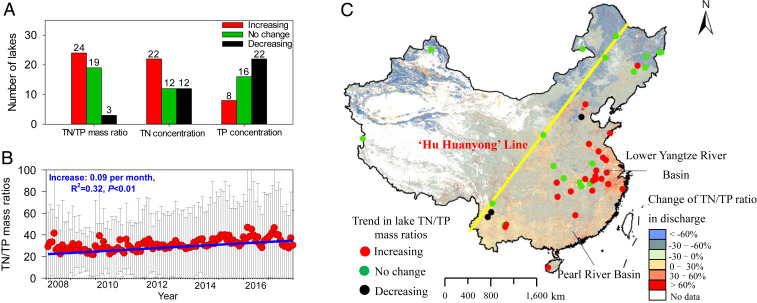
Fig. 2.
Summary of nutrient concentrations and their mass ratios changes in 46 lakes with continuous monitoring data during 2008 to 2017 (A), temporal trends of TN/TP mass ratios (B) and relative changes on TN/TP mass ratios in aggregated anthropogenic discharges (C, with a spatial resolution of 1 km2 grid). Red dots in B represent the average values of monthly TN/TP mass ratios, and black error lines represent the SDs. Definitions of “increasing,” “no change,” and “decreasing” are provided in the methods. Change of TN/TP ratio in discharge refers to the change of TN/TP mass ratio in the grid in 2017 compared with the value in 2008. The Hu Huanyong Line is used as a geographic boundary between the highly developed and densely populated Eastern region and the less-developed and sparsely populated Western region in China. The details about the nutrient concentrations, locations, and hydrological information for 46 lakes are provided in SI Appendix, Tables S2 and S3.

