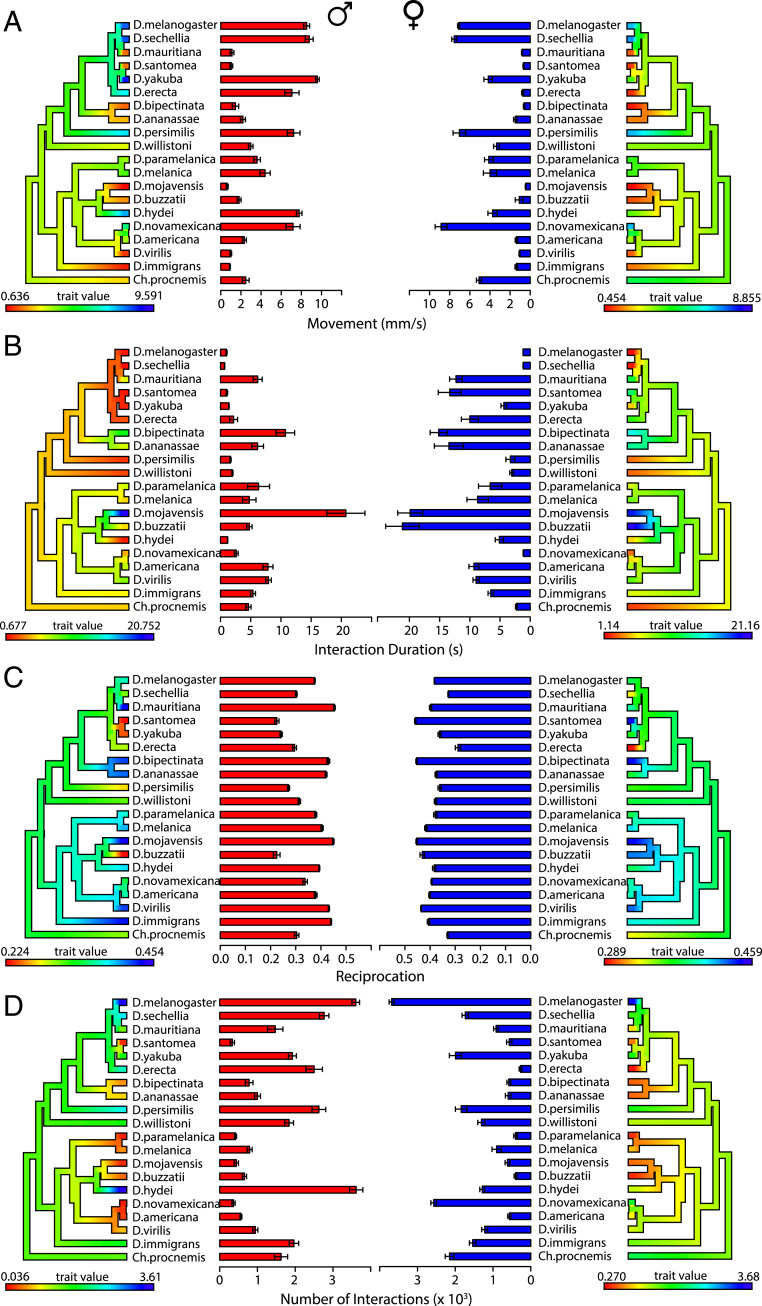
Fig. 2.
Movement, interaction duration, reciprocation, and number of interactions vary across species and between groups of male flies and female flies. Each phylogenetic tree is colored using the contMap function (phytools package) according to a scale where red indicates the minimum mean measure observed and blue indicates the maximum mean measure observed. Error bars indicate SEM. (Left) Males. (Right) Females. (A) Movement. Significant species-specific effects were observed (P < 2 × 10⁻¹⁶; two-way ANOVA). Significant sex-specific effects and sex-by-species interaction effects were observed (P = 2 × 10⁻¹⁶ for both effects; two-way ANOVA). (B) Interaction duration. Significant species-specific effects were observed (P < 2 × 10⁻¹⁶; two-way ANOVA). Significant sex-specific effects and sex-by-species interaction effects were observed (P = 2 × 10⁻¹⁶ for both effects; two-way ANOVA). (C) Reciprocation. Significant species-specific effects were observed (P < 2 × 10⁻¹⁶; two-way ANOVA). Significant sex-specific effects and sex-by-species interaction effects were observed (P = 2 × 10⁻¹⁶ for both effects; two-way ANOVA). (D) Number of interactions. Significant species-specific effects were observed (P < 2.24 × 10⁻¹¹; two-way ANOVA). Significant sex-specific effects and sex-by-species interaction effects were observed (P = 2 × 10⁻¹⁶ for both effects; two-way ANOVA).

