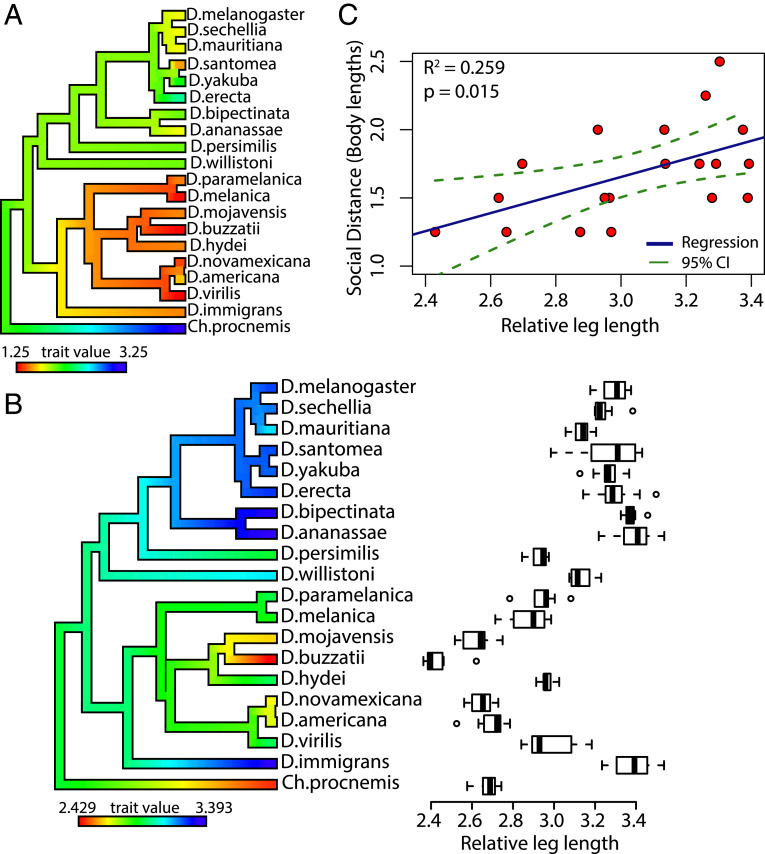
Fig. 4.
Social distance and relative leg length display phylogenetic signal and are correlated. (A) Phylogenetic trait map of drosophilid species differences in social distance. The phylogeny is colored using the contMap function (phytools package) to help visualize species differences and ancestral nodes. Red indicates the minimum value, and blue indicates the maximum value observed across the species. The social distance displays divergence between the Drosophila and Sophophora subgenera. (B) Boxplot displaying drosophilid species differences across the relative leg length (total leg length/relative body size). Circles depict outliers, whiskers represent the maximum and minimum values, and the bold line within each box represents the median. The phylogeny on the y axis is colored using the contMap function (phytools). Significant phylogenetic signal was found for relative leg length (λ = 0.99, P < 0.0001; K = 1.04, P = 0.002). (C) Simple linear regression outlining the relationship between relative leg length (x axis) and social distance (y axis). SI Appendix, Tables S3 and S4 show measurements of leg length and body size across all species. All data points in the regression are from the male dataset and the outgroup species, Ch. procnemis, was omitted from the regression.

