Fig. 1.
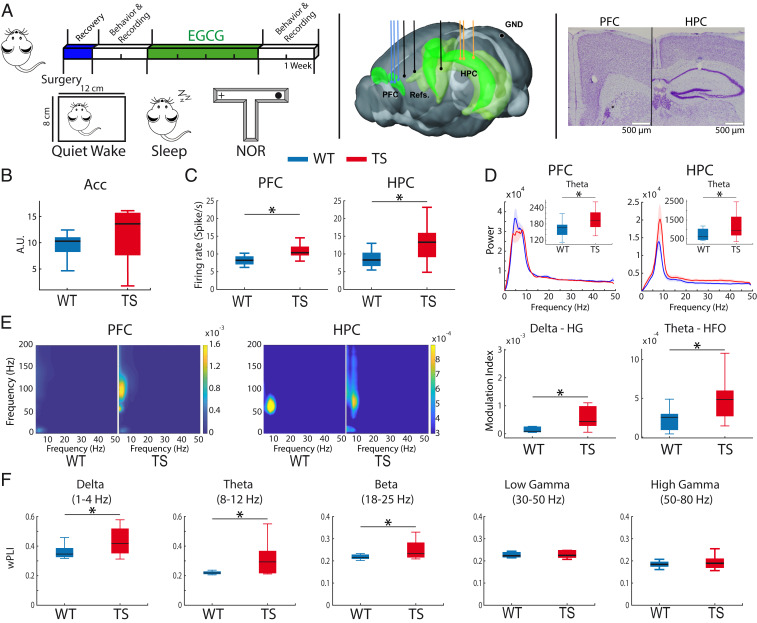
Ts65Dn mice exhibit prefrontal–hippocampal hypersynchronization during quiet wakefulness. (A, Left) Experimental timeline and brain states used. Mice were implanted with electrodes in the PFC and HPC at the beginning of the experiment. After a recovery period, behavioral and neurophysiological assessment was carried out during quiet wakefulness, natural sleep, and memory performance in the NOR task. Later, EGCG was administered for 1 month, after which memory performance and neurophysiological activity were investigated again. (Middle) Electrode placements within the PFC and HPC and corresponding references (three recording sites each) and ground (GND). (Right) Representative example of histological validation. Note the small lesions caused by low-intensity electrical stimulations, which were used to mark the tips of the electrodes after the last recording session in all animals. (B) General activity (variance of the acceleration module, Acc) was not different in alert WT (n = 10) and Ts65Dn mice (n = 12) while animals were in the recording box, where they could move but not walk. (C) Mean firing rate of individual neurons in PFC and HPC. (D) Power spectra of signals in PFC and HPC. Insets depict quantification of theta power. (E, Left) Comodulation maps of cross-frequency coupling in the PFC and HPC. The color scale indicates the modulation index (MI). (Right) Delta (3 to 5 Hz) to high gamma (80 to 120 Hz) MI in PFC and theta to high-frequency oscillation (HFO, 100 to 200 Hz) MI in HPC. Note the different scales between the PFC and HPC. (F) Phase synchronization (wPLI) between the PFC and the HPC in both genotypes. The quantification of all neural signals recorded during quiet wakefulness in WT and TS mice is summarized in SI Appendix, Table S2. Data are represented as mean ± SEM. *P ≤ 0.05.

