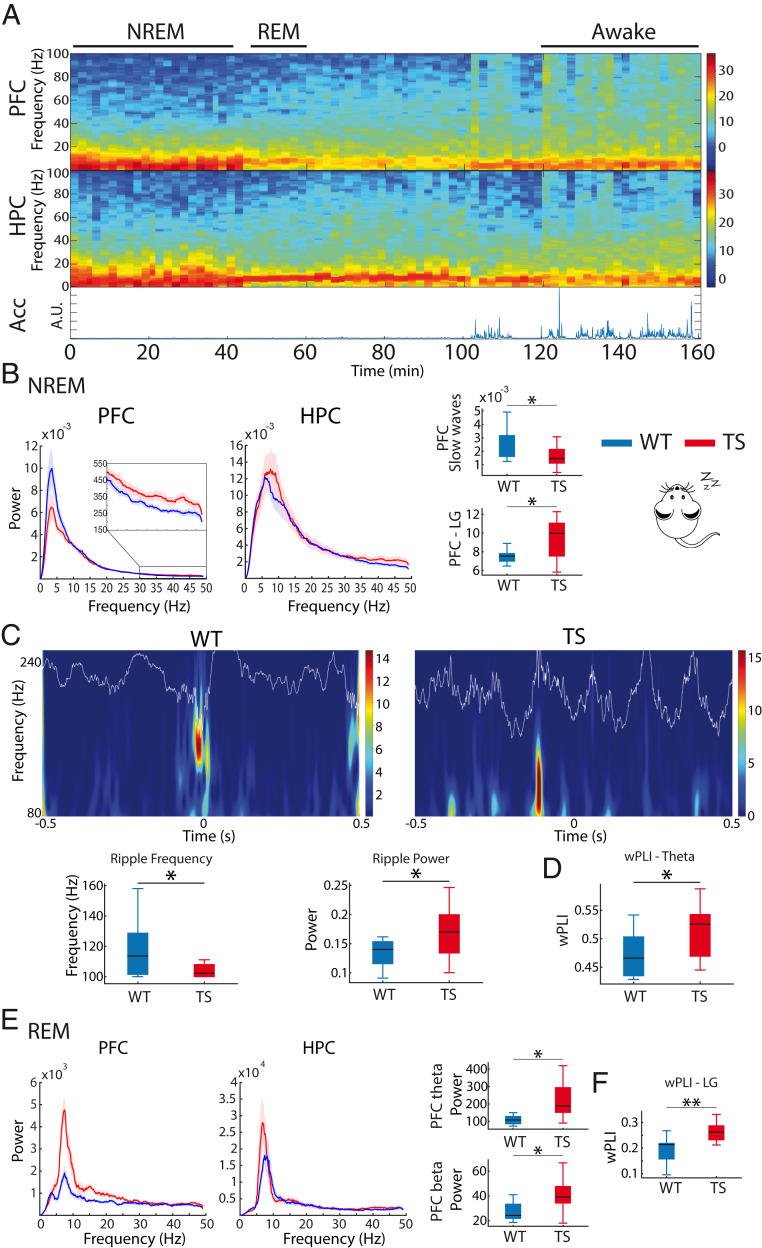
Fig. 2.
Ts65Dn mice exhibit prefrontal–hippocampal hypersynchronization during natural sleep. (A) Representative spectrograms of neural signals in the PFC and HPC from a WT mouse during wakefulness and REM and NREM sleep. Corresponding general activity (Acc) is shown below. Brain states were classified as awake (large variability of Acc, eyes open), NREM sleep (low variability of Acc, eyes closed, slow waves in PFC), and REM sleep (low variability of Acc, eyes closed, prominent theta oscillations in the HPC, absence of PFC slow waves). (B) Power spectra of neural signals in WT and Ts65Dn mice during NREM sleep. Inset amplifies spectra at low gamma frequencies (LG, 30 to 50 Hz) in the PFC. Corresponding quantification of slow waves (<4 Hz) and low gamma power in PFC is also shown. (C) Wavelet spectrogram of sharp wave ripples recorded in the CA1 area of one WT mouse and one Ts65Dn mouse during NREM sleep. The corresponding LFP traces filtered at ripple frequency (80 to 200 Hz) are superimposed. The quantification of mean ripple frequency and power for each genotype is represented below. (D) PFC-HPC phase synchronization (wPLI) at theta frequencies during NREM sleep. (E) Power spectra of neural signals in WT and Ts65Dn during REM sleep. Corresponding quantification of theta and beta power in PFC is also shown. (F) PFC-HPC phase synchronization (wPLI) at low gamma frequencies during REM sleep. The quantification of all neural signals recorded during sleep in WT and TS mice is summarized in SI Appendix, Table S2. Data are represented as mean ± SEM. *P ≤ 0.05, **P ≤ 0.01.

