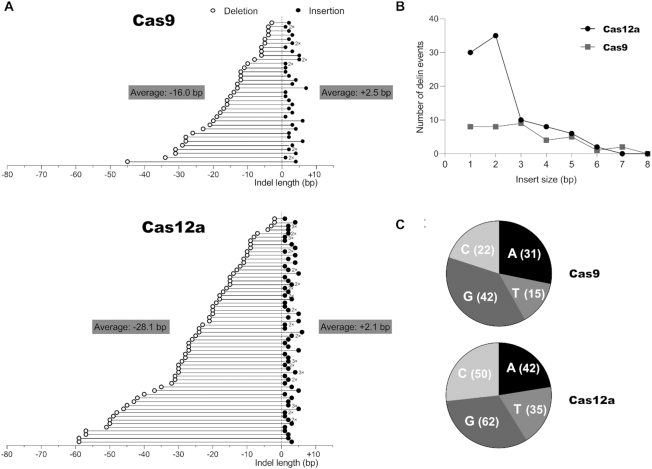
Figure 7.
Analysis of the new delin mutation class. (A) Size of the deletion and insertion component in delins. We analyzed the delin class generated by Cas9 (top) and Cas12a (bottom). The size (in bp) of the combined deletion (open circle) and insertion (closed circle) is plotted to the left/right of the Y-axis. For Cas12a, we observed two larger deletions (> 80 bp) that are not plotted. The average sizes were calculated for all plotted data points. Distinct delins with the same sizes of the deletion-insertion are marked (e.g. 2×). (B) Size of delin inserts. Frequency distribution of the insert size (in bp) of the delin class of mutants. (C) Nucleotide composition of delin inserts. This analysis was performed for the positive or sense strand of the HIV target sequence.

