Figure 3.
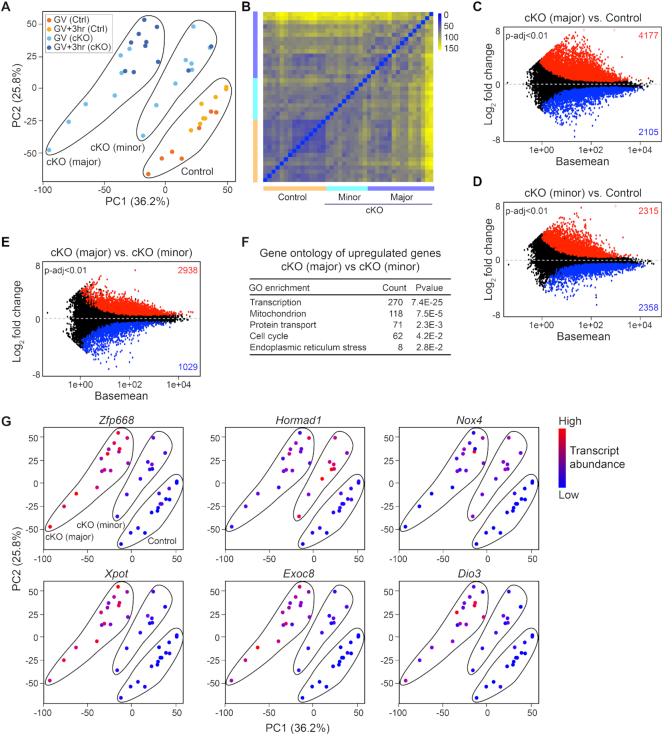
Transcriptome heterogeneity of Exosc10cKO oocytes underlies the subfertility. (A) PCA of 41 libraries of control and cKO oocytes at combined GV and GV3h stages. Subsequently the 41 libraries were sub-clustered by k-means algorithm into three groups: control; cKO (major); and cKO (minor). Dots are color-coded to indicate library source. (B) Sample distance matrix of the 41 libraries in A. (C and D) MA-plots of cKO (major) versus control and cKO (minor) versus control libraries. (E) MA-plot of cKO (major) versus cKO (minor). The increased and decreased transcripts in each comparison are labeled by red and blue, respectively (P-adjust <0.01). (F) Gene ontology of the more abundant transcripts with log2 fold change more than 1 in E. (G) PCA plots of A that is color-coded by the expression level of six different transcripts in individual oocytes. The control, cKO (major) and cKO (minor) groups in each plot are the same as labeled in the first plot.

