Figure 5.
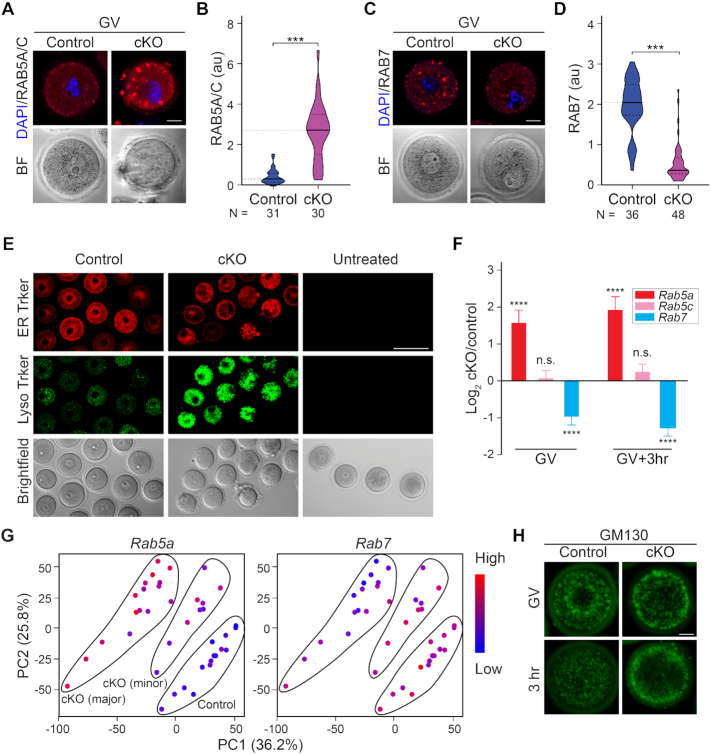
Exosc10cKO oocytes have disrupted endomembrane system. (A) Immunostaining of oocyte RAB5A/C (early endosome) at the GV stage. (B) Quantification of RAB5A/C vesicle fluorescence intensity in A. (C) Same as A, but for RAB7 (late endosome). (D) Quantification of RAB7 vesicle intensities in C. For the violin plots in B and D, the inside horizontal lines inside represent the median and the dash lines represent the quartiles. **** P < 0.0001, two-tailed Student's t-test. Number of oocytes is indicated below each group. (E) Live imaging of oocytes derived from control and cKO incubated with ER Tracker and LysoTracker. The untreated group is in the right column. (F) A bar graph showing mean and standard error of log2 fold change of Rab5A, Rab5C and Rab7 transcripts from single oocyte RNA-seq. **** P < 0.0001, n.s. no significance, which are the P-adjust values by DESeq2 analysis. (G) PCA plots of Rab5 (left) and Rab7 (right) that is color-coded by the expression level of each transcript in individual oocytes. The control, cKO (major) and cKO (minor) groups are labeled in the Rab5 plot. (H) Immunostaining of GM130 for Golgi apparatus at GV and 3 h stages. Scale bars: 20 μm in A, C, H; 1 μm in E. Arbitrary fluorescence units (au) in B and D.

