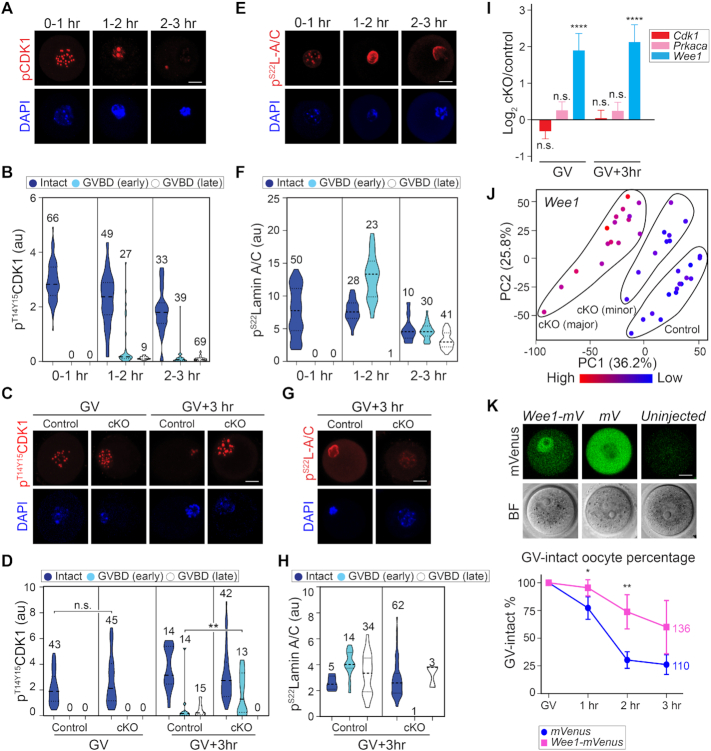
Figure 6.
Exosc10cKO oocytes with inhibitory CDK1 lack lamina phosphorylation and GVBD. (A) Confocal fluorescence images of inhibitory phosphorylated CDK1 (pT14/Y15CDK1) and DAPI in wild-type oocytes at different time points during ex vivo culture and GVBD. Oocytes were collected every 30 min and combined into three stages: 0–1 h includes 0 and 0.5 h stages; 1–2 h includes 1 and 1.5 h stages; 2–3 h includes 2, 2.5 and 3 h stages. (B) Quantification of pT14/Y15CDK1 in A. Number of oocytes are indicated above each group. At each time points, oocytes are clustered as Intact, GVBD-early or GVBD-late based on lamin B integrity. (C) Representative images of pT14/Y15CDK1 in oocytes at GV and GV3h stages derived from control and cKO mice. (D) Quantification of pT14/Y15CDK1 fluorescence intensities in C. The numbers of oocytes from at least three experiments are indicated above each group. (E) Same as A, but for pS22lamin A/C (pS22L-A/C). (F) Same as B, but for pS22lamin A/C. (G) Same as C, but for pS22lamin A/C only at GV3h. (H) Same as D, but for pS22lamin A/C only at GV3h. (I) Bar graph of mean and standard error of log2 fold change of Cdk1, Prkaca, Wee1 transcripts from the single oocyte RNA-seq. **** P < 0.0001, n.s. no significance, which are the P-adjust values by DESeq2 analysis. (J) PCA plot of Wee1 that is color-coded by the expression level in each oocyte. The control, cKO (major) and cKO (minor) groups are labeled in the plot. (K) Fluorescence of Wee1-mVenus and mVenus over-expression in GV-intact oocytes. The quantification of GV-intact oocyte percentage in 3 h ex vivo culture is at the bottom. Each dot shows mean and standard deviation. ** P < 0.01, * P < 0.05 by two-tailed Student's t-test. The horizontal lines in B, D, F, H represent the median and quartiles. Scale bars: 20 μm in A, C, E, G, K.

