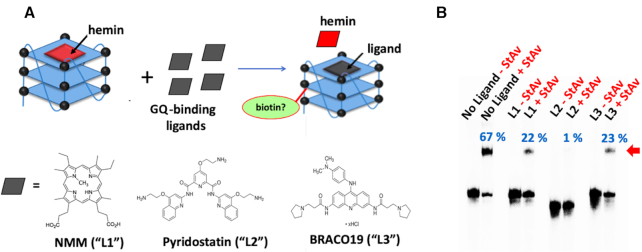
Figure 8.
The competitive effect of GQ-binding ligands. (A) A schematic showing of 10 min treatments of ∼1 μM heme–GQ complex (made by complexation of 1 μM ‘CatG4-ext’ with 5 μM hemin) with 20 μM of, individually, NMM, pyridostatin and BRACO19 GQ-binding ligands. (B) A native gel showing StAv-retarded bands of biotinylated CatG4-ext complexed with added StAv (shown with a red arrow). The percentage of this retarded complex (with respect to the total DNA in a given lane) is indicated in blue above each lane.

