Figure 4.
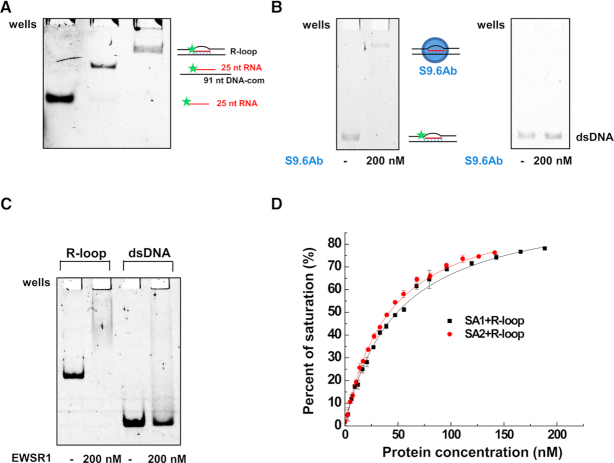
Cohesin SA1 and SA2 bind to the model R-loop substrate. (A) Native gel showing 25-nt RNA, the RNA:DNA hybrid, and the gel-purified three-stranded model R-loop substrate. In the schematic illustrations of the substrates, the star represents the 5′ fluorescein label. The sequences of RNA and DNA oligos for making the model R-loop substrate are shown in Supplementary Table S1. (B) EMSA showing the S9.6 antibody binding to the model R-loop substrate (left panel), and no significant binding of the S9.6 antibody to the control 69-bp dsDNA (right panel). (C) EMSA showing EWSR1 binding to the model R-loop substrate, and no significant stable binding of EWSR1 to the control 66-bp dsDNA. (D) Fluorescence anisotropy showing concentration-dependent binding of SA1 and SA2 to the model R-loop substrate. The data were fitted to the law of mass action (R2 > 0.99). The error bars (standard deviations) are from three measurements. The equilibrium dissociation constants (Kd) were calculated from at least two independent experiments (Table 1).

