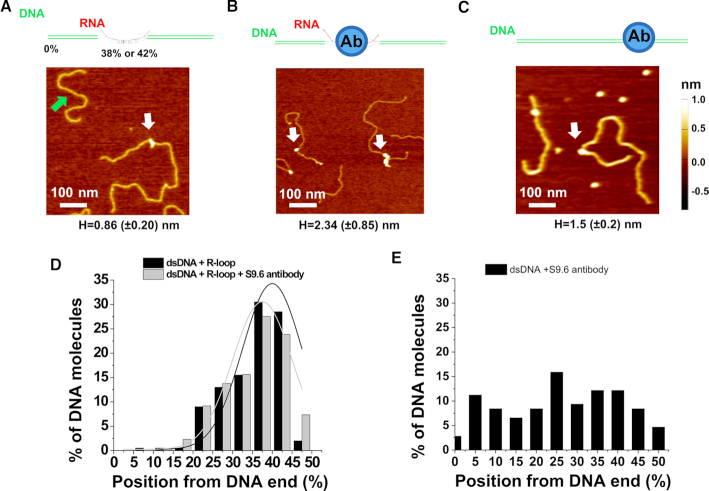
Figure 5.
AFM imaging validates the presence of R-loops on the long linear DNA. (A–C) Cartoon drawings of the DNA substrate and S9.6 antibody (top panels), and AFM images of the long linear DNA containing the R-loop (white arrow, R-loop DNA), the short fragment without R-loops (green arrow, A), the R-loop DNA with S9.6 antibody (white arrows, B), and control dsDNA with the S9.6 antibody (white arrow, C). The letter H denotes the maximum AFM height along the linear dsDNA (mean ± SD). (D and E) Position distributions of R-loop structures (N = 200) and R-loop-S9.6 antibody complexes (N = 218) along the linear R-loop DNA (D), and S9.6 antibody along the control dsDNA without R-loops (N = 108, E). Positions were measured from the closest DNA ends. Based on the AFM heights of R-loop (0.86 ± 0.20 nm), structures on the R-loop DNA with AFM heights greater than 1.0 nm were selected as R-loop-S9.6 complexes (Supplementary Table S2). The lines in (D) are Gaussian fits to the data (R2>0.8), with peaks centered at 40.0% (± 7.5%) and 37.5% (±7.5%), respectively, for R-loops and R-loop-S9.6 antiboy complexes.

