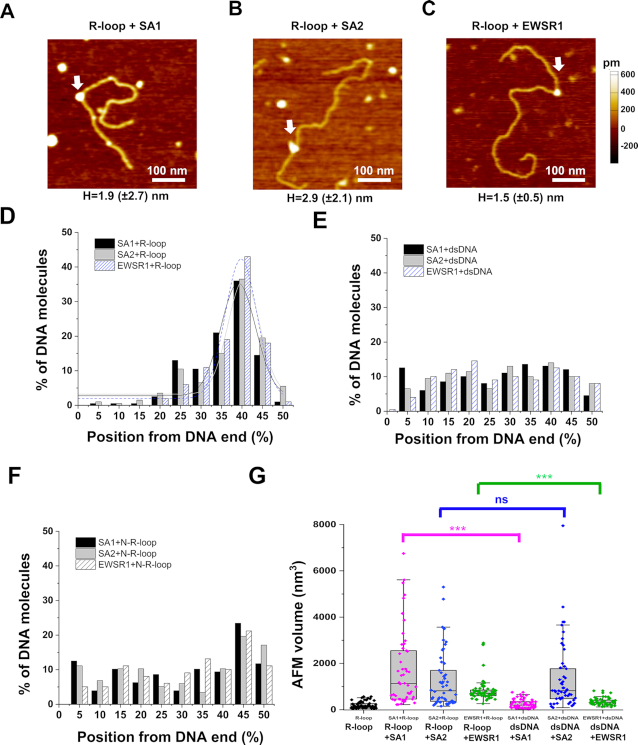
Figure 6.
Cohesin SA1 and SA2, as well as EWSR1, localize to regions containing R-loops on dsDNA. (A–C) AFM images of the R-loop DNA in the presence of SA1 (A), SA2 (B) or EWSR1 (C) (white arrows). (D–F) The position distributions of SA1, SA2, and EWSR1 on the linear R-loop DNA (D) and control dsDNA (E) and negative control N-R-loop DNA (F). The lines in (D) are Gaussian fits to the data (R2> 0.83), with peaks centered at 39.1% (±8.5%) for SA1, 40.4%(±7.8%) for SA2, and 39.8% (±7.8%) for EWSR1. N = 200 for each data set from at least three independent experiments (Supplementary Table S2). Structures on the R-loop DNA with AFM heights greater than 1.0 nm were selected as R-loop-protein complexes (Supplementary Table S2). (G) AFM volumes of R-loops alone on dsDNA, SA1-R-loop, SA2-R-loop, EWSR1-R-loop, SA1-dsDNA, SA2-dsDNA and EWSR1-dsDNA. N = 50 for each data set. The Box–Whisker plots show 25–75%, the median, and range within 1.5 IQR. *** P < 0.001 based on the Mann–Whitney test.

