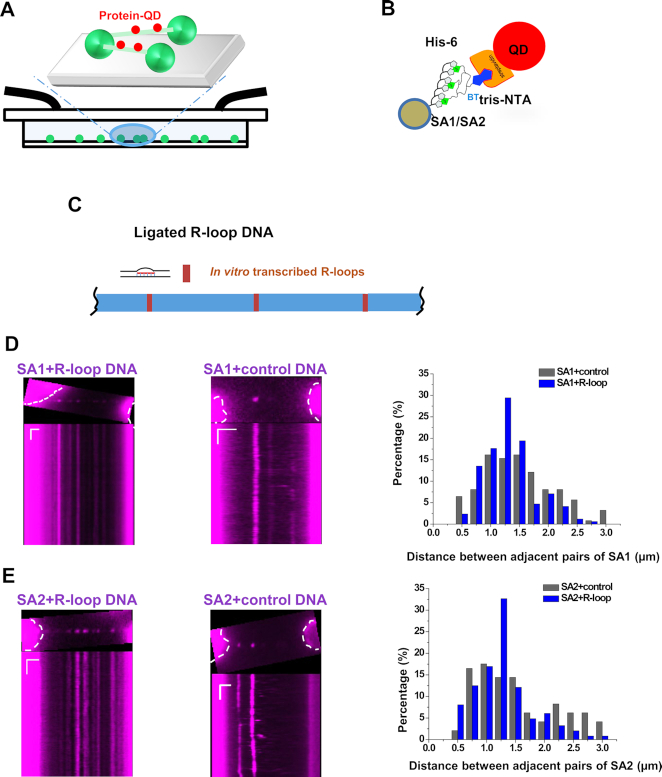
Figure 7.
SA1 and SA2 localize to regions containing RNA on DNA tightropes. (A) Schematics of the DNA tightrope assay showing QD-labeled proteins (red) loading onto DNA (green) anchored between micron-sized beads. (B) QD conjugation strategy: His-NTA-biotin/streptavidin-QD sandwich method for His-tagged SA1 and SA2 proteins. (C) Schematics of ligated DNA tightropes containing R-loops formed through in vitro transcription. (D and E) Images (top panels) and kymographs (bottom panels) of red (655 nm) QD-labeled SA1 (D) and SA2 (E) on the ligated DNA tightropes containing R-loops (left panels) and control DNA tightropes (middle panels), and measurements of the distance between adjacent protein pairs on DNA tightropes (right panels). The dotted white lines mark the contour of the beads. SA1: N = 136 pairs on the control DNA; N = 175 pairs on the R-loop DNA. SA2: N = 116 pairs on the control DNA; N = 257 pairs on the R-loop DNA. Length scale bar: 5 μm; Time scale bar: 1 s.

