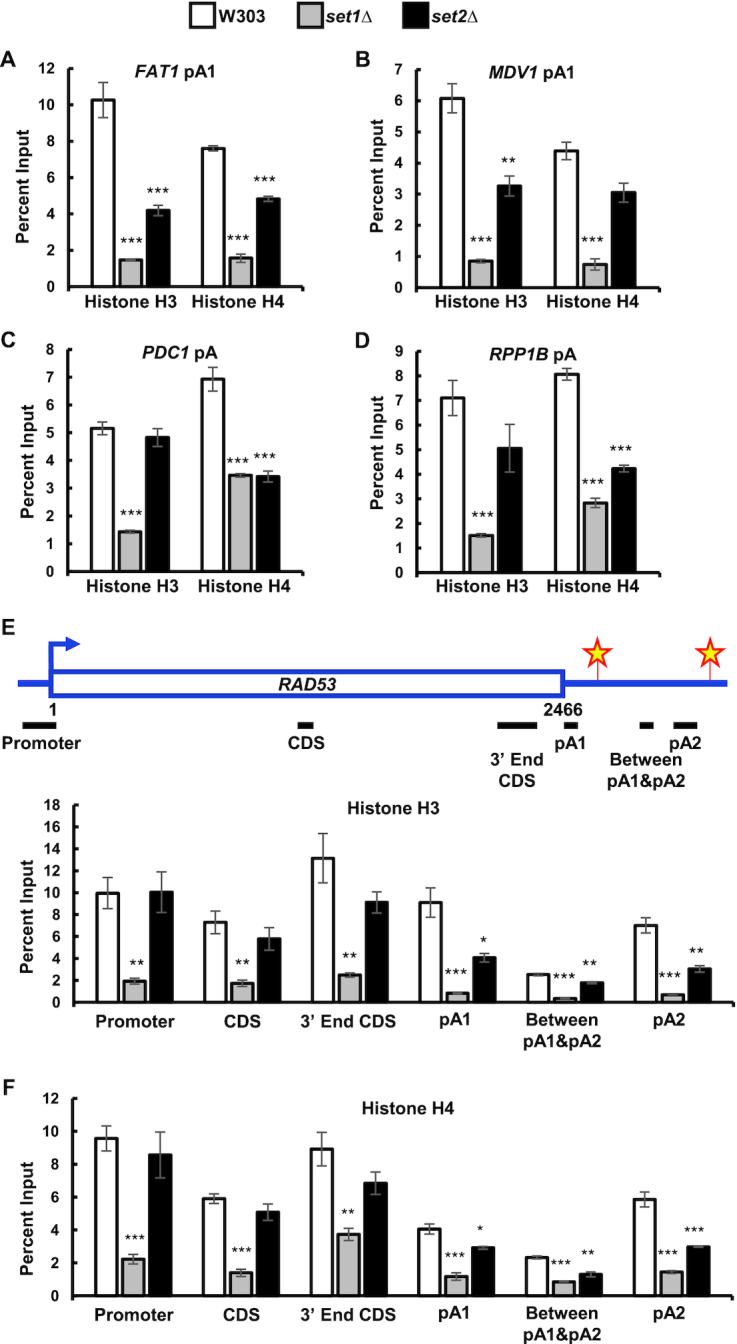
Figure 3.

SET1 and SET2 deletion decreases nucleosome occupancy around pA sites. (A–D) ChIPs for histone H3 and histone H4 around FAT1, MDV1, PDC1 and RPP1B pA sites in wild-type (W303), set1Δ and set2Δ cells. (E) ChIPs for histone H3, and H4 (F) along the RAD53 gene in wild-type, set1Δ and set2Δ cells. Primer pairs indicated above the bar graphs were specific for the RAD53 promoter, coding sequence (CDS), 3′ end of coding sequence, pA1 site, region between pA1 and pA2 sites, as well as pA2 site. Two biological replicates were performed for each gene. Bars show average values ± SD. *P < 0.05, **P < 0.01, ***P < 0.001 (Student's t-test).
