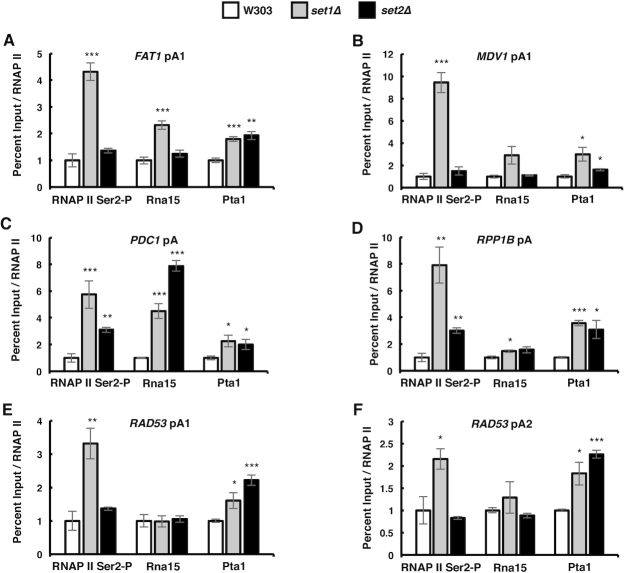
Figure 5.
SET1 and SET2 deletion enhances the RNAP II CTD Ser2-P and the cleavage/polyadenylation complex levels at pA sites. (A–F) ChIP of the RNAP II CTD serine-2 phosphorylation, Rna15 and Pta1 to FAT1, MDV1, RAD53, PDC1 and RPP1B pA sites in wild-type, set1Δ and set2Δ cells. The values were normalized relative to RNAP II occupancy. Two biological replicates were performed for each gene. Bars show average values ± SD. *P < 0.05, **P < 0.01, ***P < 0.001 (Student's t-test).

