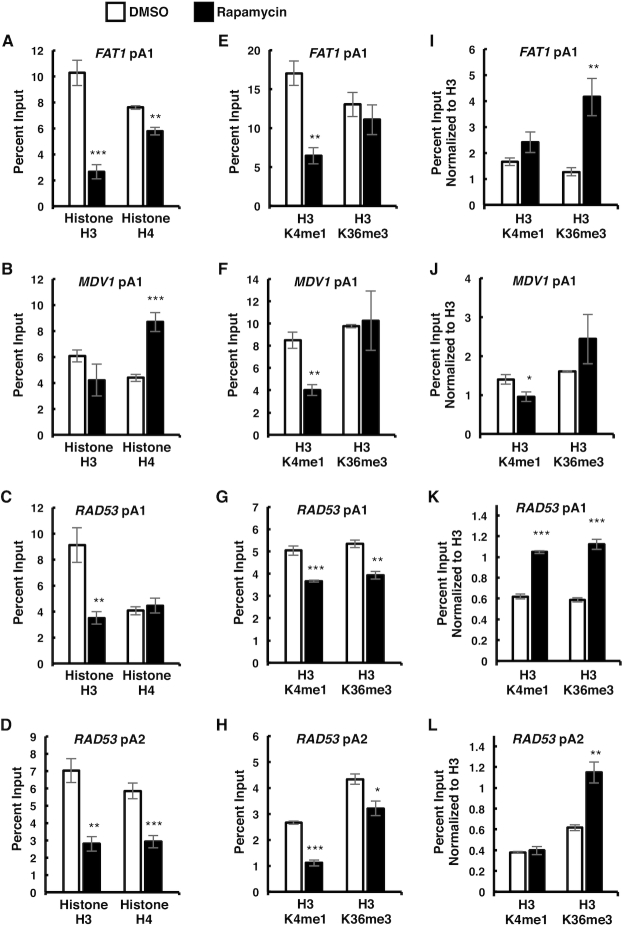
Figure 7.
mTOR inhibition leads to epigenetic changes. (A–D) ChIPs for histone H3 and histone H4 around FAT1, MDV1, and RAD53 pA sites in wild-type S. cerevisiae exponentially growing in YPD media and shifted to media containing 10 nM rapamycin (for 2 h) or DMSO as a solvent control. (E–H) ChIPs for histone H3K4me1 and histone H3K36me3 near FAT1, MDV1 and RAD53 pA sites in wild-type cells from (A–D). (I–L) Same data as (E–H) normalized to total histone H3 levels from (A–D). Two biological replicates were performed for each gene. Bars show average values ± SD. *P < 0.05, **P < 0.01, ***P < 0.001 (Student's t-test).

