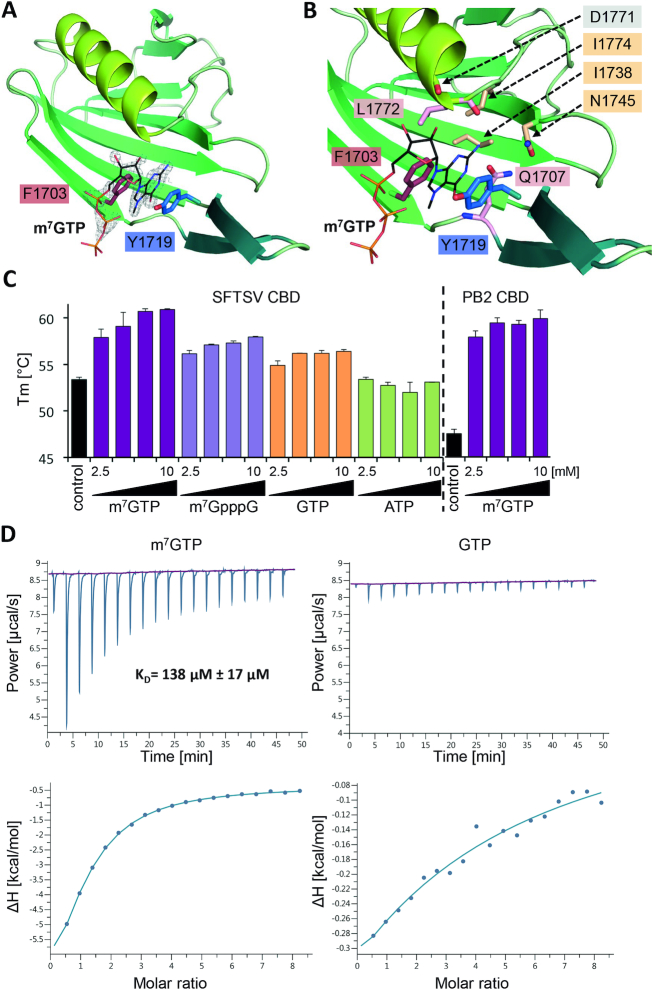
Figure 5.
Structure of SFTSV CBD and m7GTP binding. (A) The figure shows SFTSV CBD crystal structure in complex with an m7GTP. SFTSV CBD is presented as a ribbon diagram with the side chains of the two aromatic residues (F1703, Y1719) involved in stacking interaction with the m7GTP ligand shown as sticks. m7GTP is presented as lines and the surrounding electron density (2|Fo|-|Fc| omit map at 2.0σ) as gray mesh. (B) In a close-up of the m7GTP binding site, the protein is shown as ribbon diagram and side chains involved in m7GTP binding as well as the carbonyl oxygen of residue D1771 are presented as sticks. The m7GTP is shown as lines. The residues I1774, I1738, N1745, are involved in stabilizing the binding site cavity, D1771 (carbonyl oxygen), Q1707 and L1772 directly interact with m7GTP. A detailed list of interactions between the CBD and the m7GTP ligand is given in Supplementary Table S4 and a ligand plot in Supplementary Figure S13A. (C) Thermal stability of SFTSV CBD and influenza A virus PB2 CBD was tested in the presence and absence of different concentrations (2.5, 5.0, 7.5 and 10 mM) of m7GTP, m7GpppG, GTP and ATP. The melting temperatures (Tm) are presented as mean and standard deviations of three independent measurements (n = 3). (D) The affinity of SFTSV CBD for m7GTP and GTP was measured by isothermal titration calorimetry at 25°C. A representative titration curve is shown. Titrations were done three times with 150 μM SFTSV CBD in the cell and 5.0–6.5 mM m7GTP or GTP in the syringe. The upper panel shows the raw data, the lower panel the integrated data fitted to a single-site binding model with the stoichiometry fixed to 1. The dissociation constant KD is given as a mean and standard deviation of three independent measurements for m7GTP.

