Figure 1.
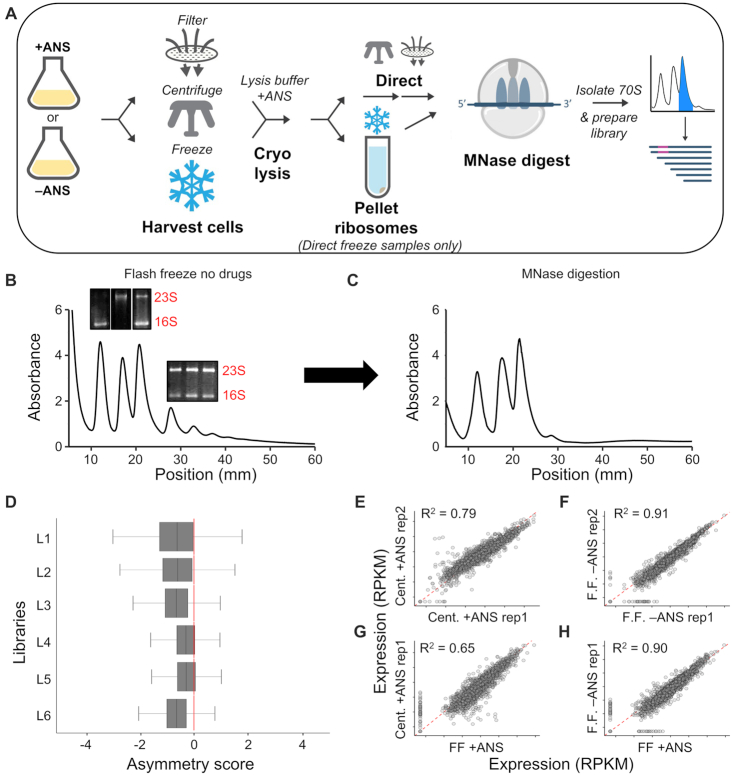
Evaluation of ribosome profiling protocols for Hv. (A) Schematic of the ribosome profiling methods used in this study. Sucrose gradients of ribosomes from cells harvested by direct flash freezing in liquid nitrogen with no drugs added to cultures showing (B) intact monosome and polysome fractions, and (C) successful collapse of polysomes into monosomes after MNase digestion. Inset in (B): Total RNA agarose gels showing rRNA from various peaks corresponding to 30S, 50S, 70S, and polysome fractions. (D) Asymmetry scores were calculated as the normalized ribosome density upstream of the halfway point of an ORF over the ribosome density downstream of the halfway point of an ORF. L1 = Cent + ANS rep1, L2 = Cent + ANS rep2, L3 = FF + ANS, L4 = FF no drug rep. 1, L5 = FF no drug rep. 2, L6 = FF + Harringtonine). (E–H) Correlation plots of translation expression (in rpkm) for ribosome profiling libraries of various conditions. ANS, anisomycin; Cent, centrifugation; FF, flash-freezing; rep, biological replicate.

