Figure 3.
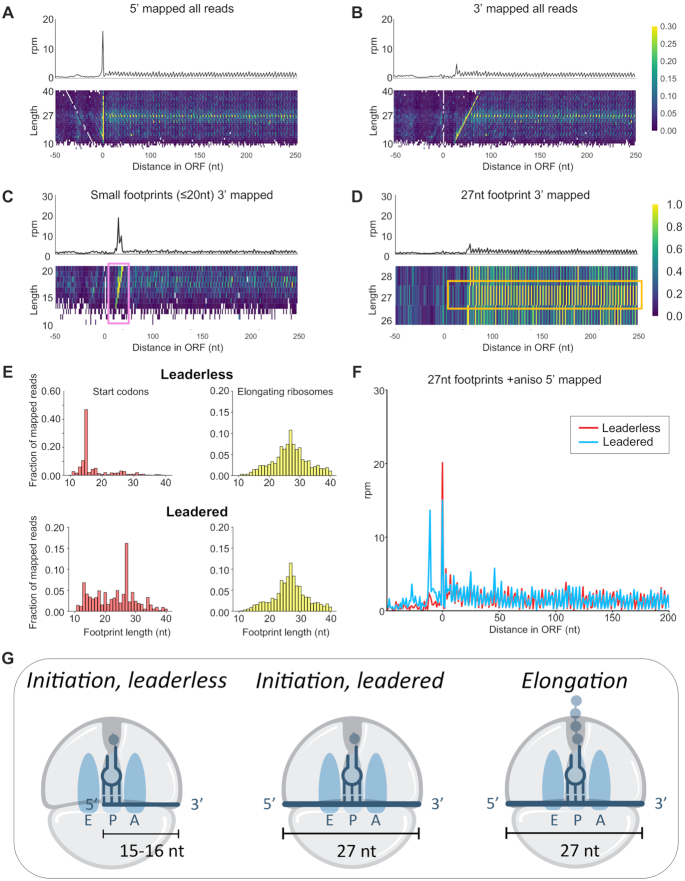
Different length ribosome footprints represent different translational states. Meta-gene plots, from flash frozen and no drug exposure Hv cultures, of ribosome density mapped using the (A) 5′-end and (B) 3′-end of ribosome footprints (rpm = reads per million). Heatmaps of footprint density separated by length are aligned underneath the meta-gene plots. (C) 3′-mapped meta-gene analysis of small footprints (10–20 nt) and (D) of 27 nt footprints from flash frozen and no drug cultures. (E) Footprint length distribution of 5′-mapped ribosome density for initiating ribosomes at the start codon (at P-site) in leadered (5′ UTR ≥ 10 nt) and leaderless (0 nt) transcripts (left, red) and elongating ribosomes within the open reading frames (right, yellow). (F) 27 nt footprints on leadered (5′ UTR ≥ 10 nt) and leaderless (0 nt) messenger RNAs from flash frozen and anisomycin (ANS) treatment prior to harvesting. (G) A model for footprint lengths corresponding to ribosome translation states. Small footprints (∼15–16 nt) correspond to initiation on leaderless transcripts, and 27 nt footprints correspond to initiation on leadered transcripts and to elongation on all transcripts.

