
Figure 5.
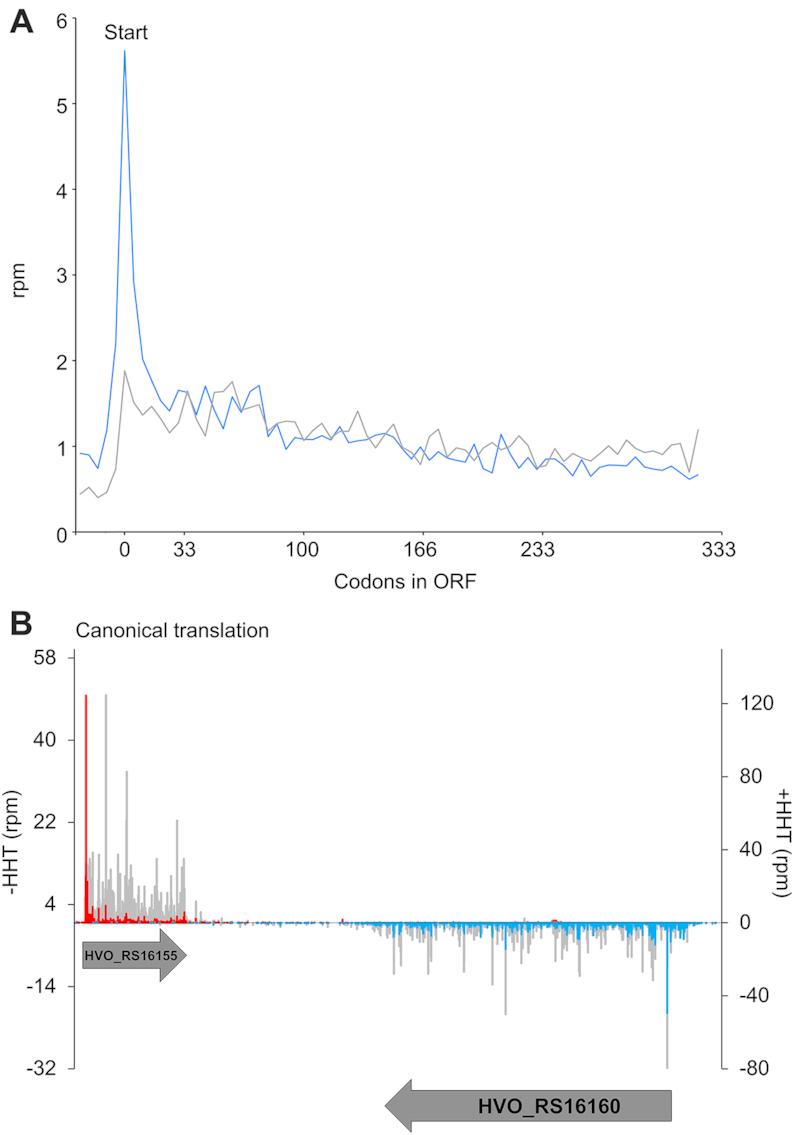
Harringtonine (HHT) locks ribosomes at translation start sites. (A) Meta-gene analysis plot of ribosome density along ORFs 1 kb downstream from the TSS. The blue line is HHT treatment and the gray line is no-drug treatment. (B) Representative plots of translation start site identification in annotated genes. Blue bars are HHT ribosome density on the minus strand, red bars are on the plus strand. Gray bars are ribosome density from untreated samples on both strands.