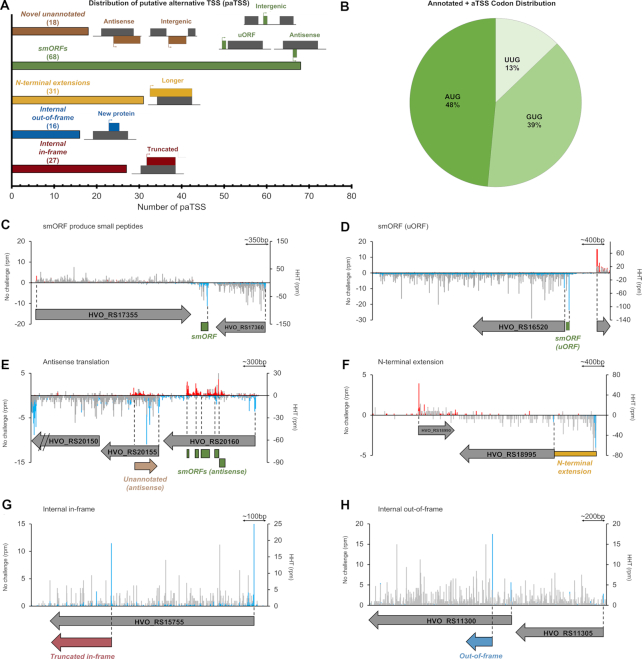
Figure 6.
Identification of putative alternative translation initiation sites (paTSS). (A) Distribution of HHT-identified paTSS. (B) Distribution of canonical initiation codons for HHT-identified paTSS. (C–H) Representative examples of paTSS identified in HHT-treated cells. (C) Intergenic smORF, (D) upstream smORF (uORF), (E) antisense translation initiation, (F) N-terminal extensions, (G) internal in-frame and (H) internal out-of-frame initiation. Plus strand is plotted with positive values and minus strand with negative values. Untreated samples are shown with gray bars on both strands, HHT conditions on the plus strand are red bars, and blue bars are HHT conditions on the minus strand.

