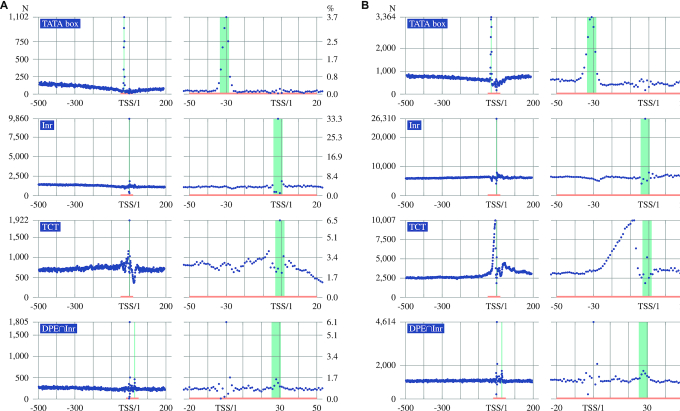
Figure 2.
Local overrepresentation of CPEs in promoters and transcribed enhancers. (A) Promoters. (B) Transcribed enhancers. The panels show the occurrence counts for the CPEs TATA, Inr, TCT and DPE in positions −500 to +200 with respect to the TSS. DPE∩Inr: DPE was only called in sequences that contained an Inr motif. Each CPE showed a statistically significant overrepresentation in the region marked in green.

