
Figure 7.
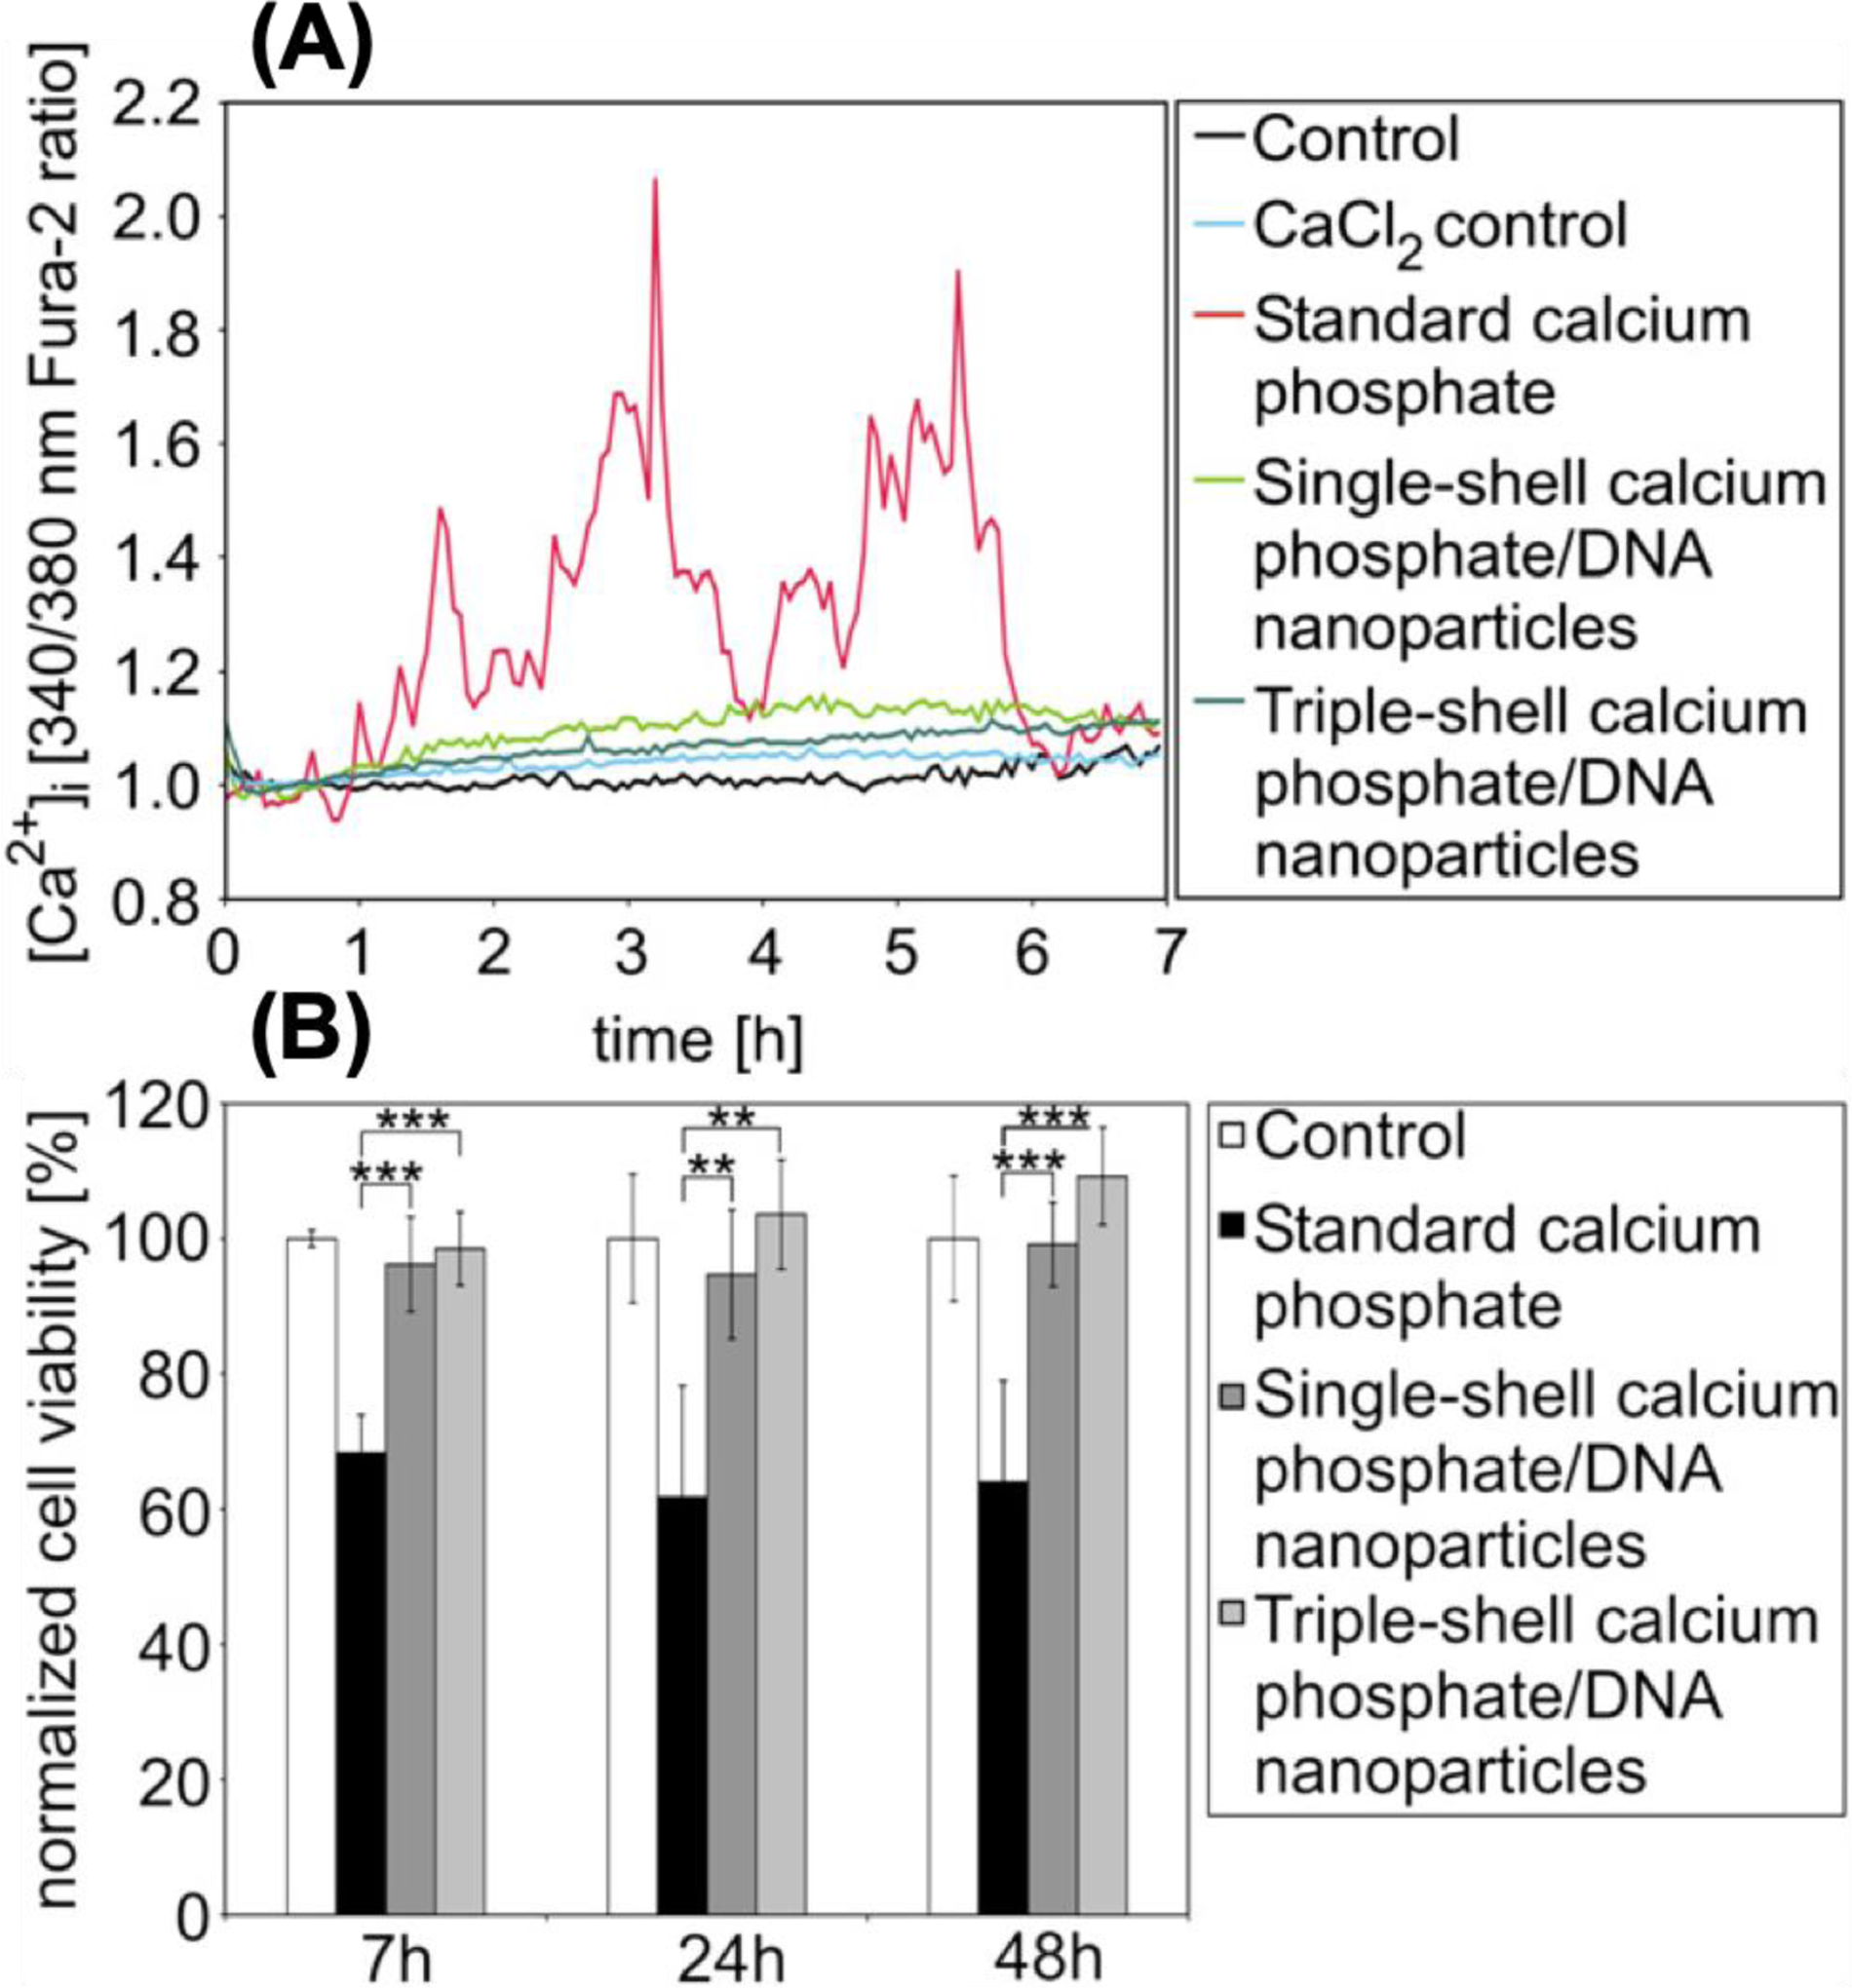
Variation of intracellular calcium level (A) and cell viability results (B) obtained from transfected T24 cells at different incubation times. Cells were transfected with single-shell and triple-shell CaP nanoparticles and results were compared with standard calcium phosphate and control samples (PBS). Fura-2 (shown in A) is a sensitive indicator dye for measuring intracellular calcium. It gets excited at 340 and 380 nm and the ratio of the emissions at these wavelengths is a representative of intracellular calcium [131]. For cell viability tests, mean values of absorption were defined as 100% for control cells during the MTT assay for cell viability quantifications. Graph bars shown in (B) represent four independent experiments. (**: p <0.01, ***: p <0.001). (Reprinted with permission from ref. [128]. Copyright 2009 Elsevier)