Fig. 4.
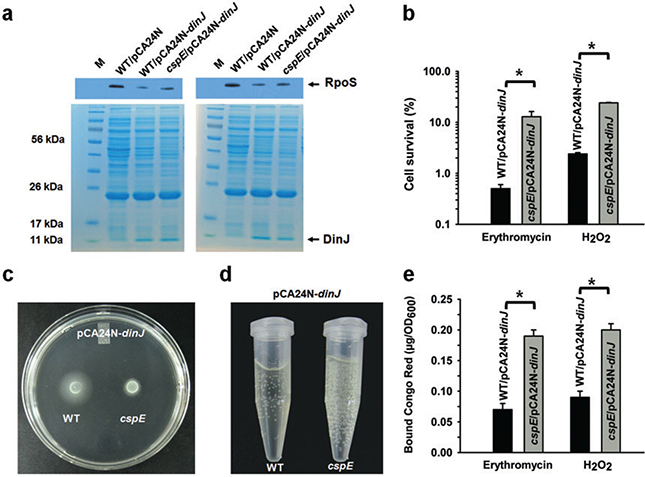
DinJ requires CspE to influence RpoS levels and RpoS-controlled viability, motility, cell adhesins and catalase activity.
A. Lanes 2, 3 and 4 show RpoS levels as detected by an anti-RpoS antibody for BW25113/pCA24N, BW25113/pCA24N-dinJ and BW25113 cspE/pCA24N-dinJ. Two independent cultures were used for each strain and both experiments are shown.
B. Percentage of cells (BW25113 cspE/pCA24N-dinJ versus BW25113/pCA24N-dinJ) which survive erythromycin (75 μg ml−1) stress for 10 min and oxidative stress induced by 20 mM H2O2 for 10 min. Error bars indicate standard error of mean (n = 2). Error bars indicate standard error of mean (n = 2). Significant changes are marked with an asterisk for P < 0.05.
C. Swimming motility after 12 h of growth at 37°C for BW25113 cspE/pCA24N-dinJ versus BW25113/pCA24N-dinJ. Two independent cultures were used, and a representative image is shown.
D. Images of BW25113 cspE/pCA24N-dinJ versus BW25113/pCA24N-dinJ cultures (turbidity of 1) 10 min after adding 40 mM H2O2. Bubbles are oxygen produced by the decomposition of hydrogen peroxide by catalase (2 H2O2 → 2 H2O + O2). Two independent cultures were used, and a representative image is shown.
E. Curli/cellulose production for strains BW25113 cspE/pCA24N-dinJ versus BW25113/pCA24N-dinJ after 3 h of incubation with 7.5 μg ml−1 erythromycin or 2 mM H2O2. All assays were performed at 30°C. Error bars indicate standard error of mean (n = 2). Significant changes are marked with an asterisk for P < 0.05.

