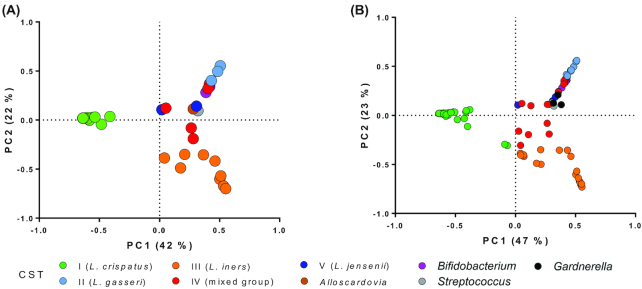
Figure 2.
PCA plots obtained using the relative abundances of bacterial taxa in each vaginal swab. Each point in the plots indicates a single vaginal swab. The color of each dot in the plots indicates the CST of the sample according to the legend reported under the chart; the colors correspond to the colors used in Fig. 3. A, baseline samples (n = 37, i.e. vaginal samples collected at V1 from the 24 volunteers who completed the study and 13 who dropped out); B, all samples (n = 109, i.e. the 37 samples collected at V1 and the samples collected at V2, V3 and V4 from the 24 volunteers who completed the study).

