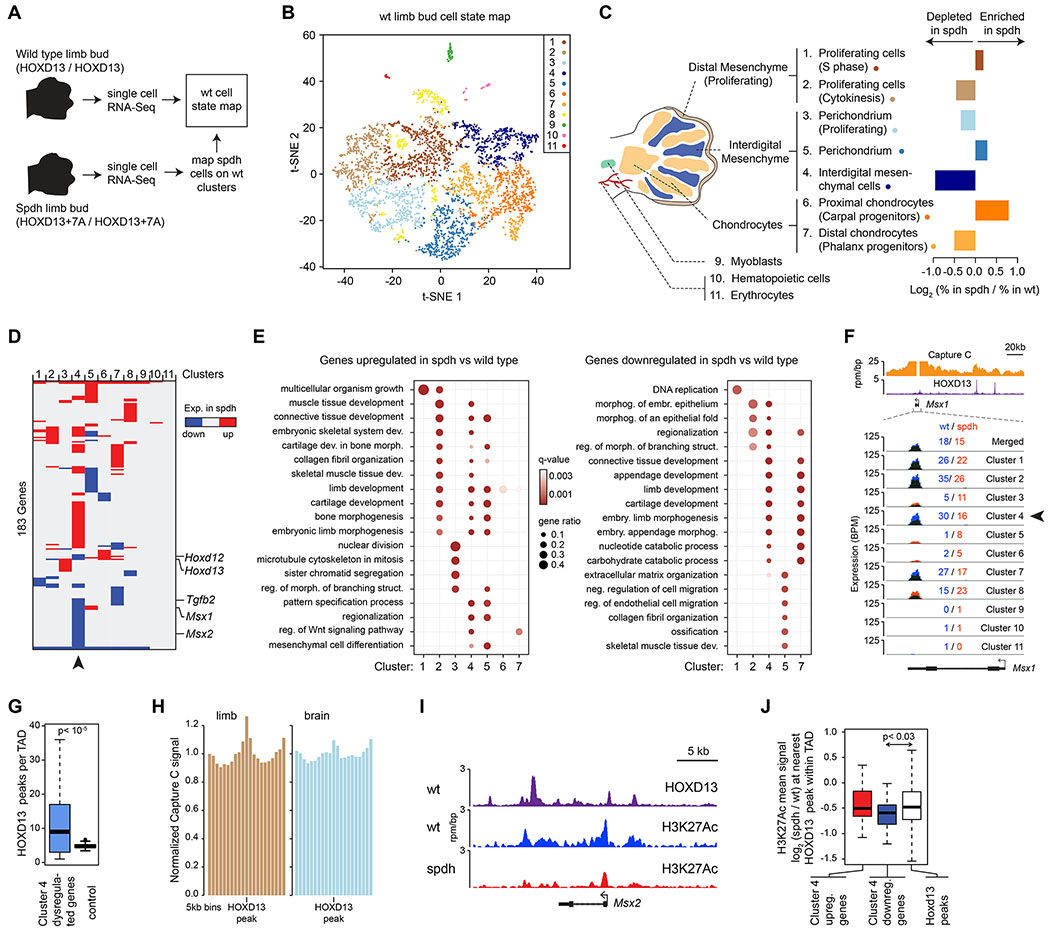
Figure 5. HOXD13 repeat expansion alters the transcriptional program of several cell types in a cell-specific manner.
(A) Scheme of the scRNA-Seq experiment strategy.
(B) Visualization of the wild-type scRNA-seq data using t-distributed Stochastic Neighbor Embedding (t-SNE).
(C) Changes in cell type composition in spdh limb buds. Displayed are the relative changes in the proportions of cells that belong to the designated clusters (i.e. cell states) between wt and spdh limb buds.
(D) Heatmap of differentially up- or downregulated genes in the spdh limb bud relative to wt within the 11 cell clusters. Arrowhead highlights the interdigital mesenchymal cells.
(E) Gene Ontology (GO) term enrichment analysis of differentially up- or downregulated genes in the spdh limb bud relative to wt within individual cell clusters.
(F) Profiles of Capture C, HOXD13 ChIP-Seq and scRNA-Seq data at the Msx1 locus. The mean expression value in spdh (red) and wt cells (blue) within each cluster are also displayed. Arrowhead highlights the expression level in interdigital mesenchymal cells, where the expression difference is the most profound.
(G) Number of HOXD13 peaks in topologically associating domains (TADs) that contain a gene dysregulated in Cluster 4. P value is from a Wilcoxon rank sum test.
(H) Mean Capture C signal around HOXD13 peaks within topologically associating domains (TADs) that contain a gene dysregulated in Cluster 4.
(I) ChIP-Seq binding profiles around the Msx2 locus.
(J) Quantification of the mean H3K27Ac signal at the nearest HOXD13 binding sites around the indicated genes within the same TAD. P value is from a Wilcoxon rank sum test.

