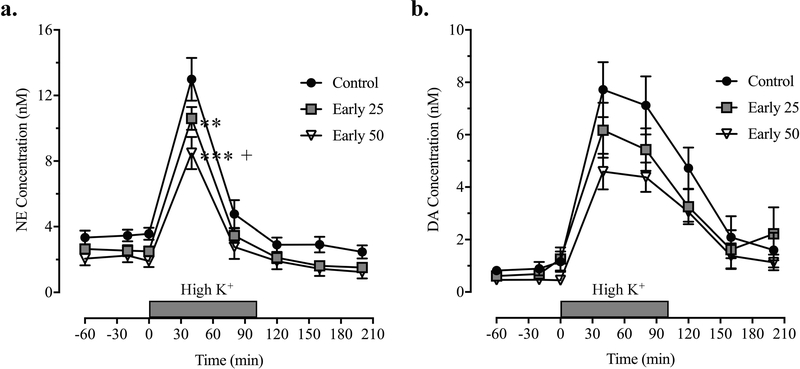
Figure 3. Mn exposure caused a significant reduction in the stimulated release of NE in the mPFC of young adolescent animals.
Concentrations of (a) NE and (b) DA in nM as a function of time after administration of a high K+ stimulus. Statistical analysis reflects differences in NE at 40 min after initiation of high K+ perfusion based on Tukey’s multiple comparison test. ** and *** indicate p < 0.01 and p < 0.0001 versus controls, respectively. + indicates p < 0.05 vs. the early 25 Mn dose. Data are means ± SEM (n = 8–12 animals/group).

