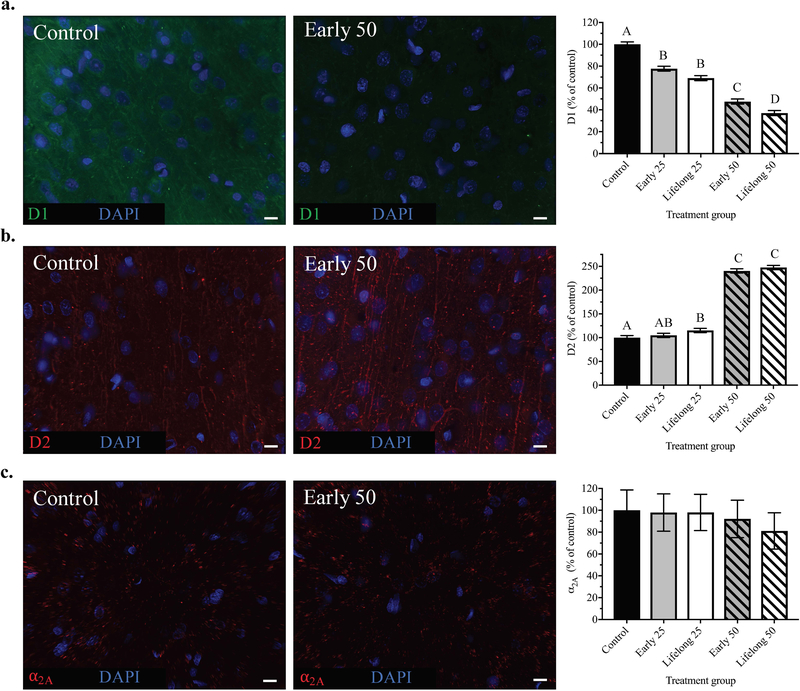
Figure 5. D1 and D2 protein levels, but not α2A, were altered by early postnatal Mn exposure.
Representative immunohistochemistry images of (a) D1, (b) D2 and (c) α2A receptor staining from mPFC brain sections of control and early life 50 Mn treatment groups. Bar charts show quantified fluorescence intensity reflecting 12–18 images/animal (40x magnification), where n = 6 animals/treatment group. Representative images at 63x magnification for clarity (scale bars, 10 μm). Data are least squares means ± SEM shown as percent of control values generated from the statistical model that included all five treatment groups. Bars with different superscripts are statistically different (p < 0.05) based on Tukey’s multiple comparisons test.

