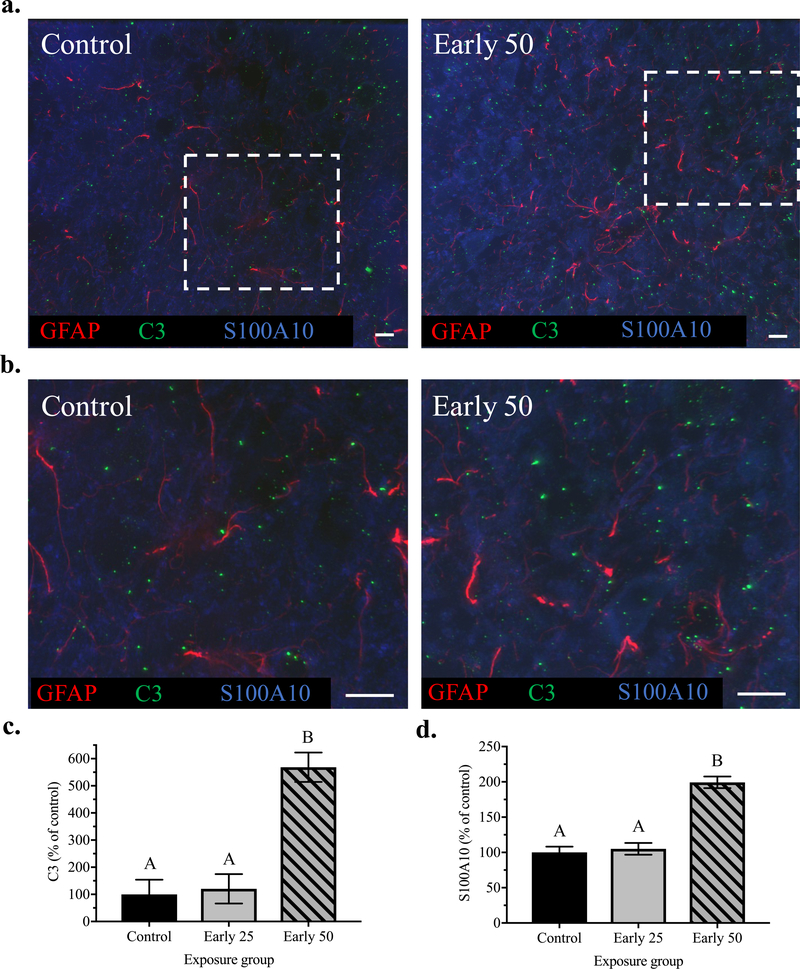
Figure 7. C3 and S100A10 protein levels are increased in response to early postnatal Mn exposure.
Representative immunohistochemistry images of (a) GFAP, C3, and S100A10 staining from mPFC brain sections of control and early life 50 Mn treatment groups at 63x magnification; white boxes are enlarged (b) for clarity (scale bars, 10 μm). (c, d) Bar charts show quantified fluorescence intensity of GFAP-colocalized puncta for C3 and S100A10, respectively; data reflect 4 images/animal, where n = 5 animals/treatment group. Data are least squares means ± SEM shown as percent of control values generated from the statistical model that included three treatment groups. Bars with different superscripts are statistically different (p < 0.05) based on Tukey’s multiple comparisons test.

