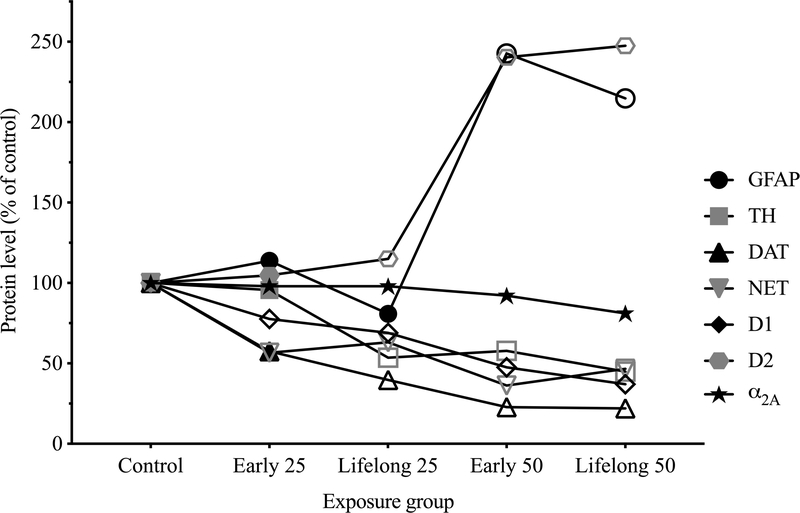
Figure 9.
Mean levels of mPFC proteins across treatment groups, with levels of each protein normalized to its respective control group (error bars omitted for clarity). Symbol shape indicates the protein, and open symbols indicate significantly different from respective control (p < 0.05), based on statistical models that included all five treatment groups.

