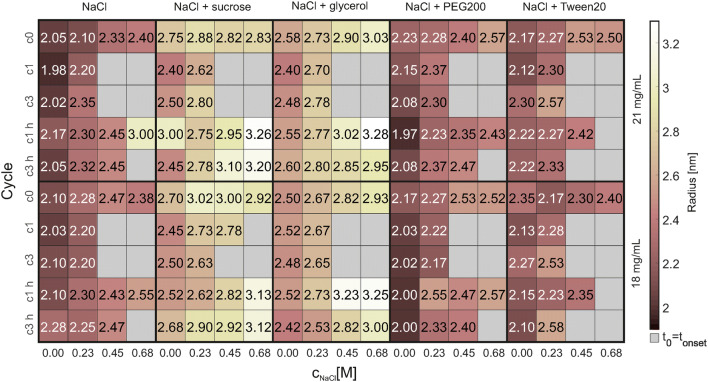
Fig. 4.
The results of the 151 DLS measurements are shown. The NaCl concentration is plotted over the cycle number for the different formulations investigated. The upper row shows the results for 21 mg/mL lysozyme and the lower row for 18 mg/mL. The color bar represents the apparent hydrodynamic radius in nm. Measurements of conditions where the box is marked gray were not possible due to aggregation appearance. The respective deviations from the triplicate measurements are shown in the “Supplementary Material” Figure S2 (color figure online)

