
Figure 2.
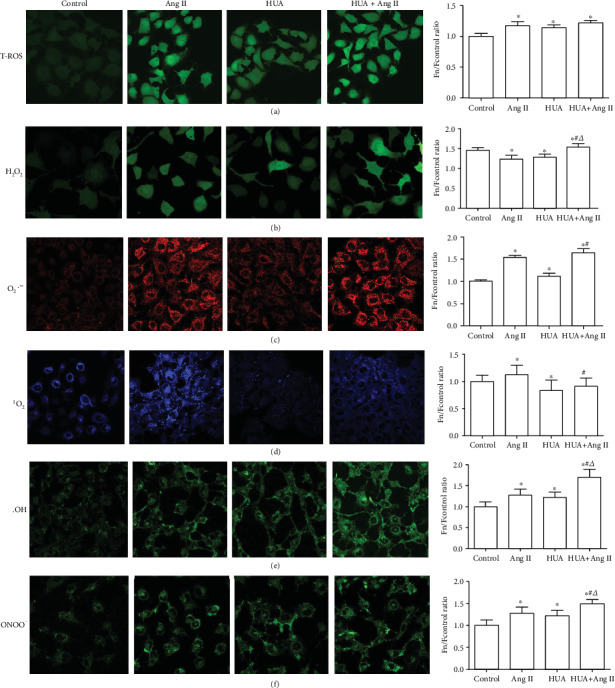
Total ROS production and ROS component generation in HUVECs induced by HUA or Ang II. HUVECs were cultured in confocal dishes and treated with 600 μmol/L UA (HUA) or 10−7 mol/L Ang II (Ang II) for 24 h. Then, cells were stained using ROS probes. (a) Compared to the control group, the HUA, Ang II, and HUA+Ang II groups generated more total intracellular ROS (∗p < 0.05), and no difference was observed between the HUA+Ang II group and the HUA or Ang II group (p > 0.05). (b) The HUA, Ang II, and HUA+Ang II groups showed remarkably increased H2O2 production compared to the control group (∗p < 0.05), and HUA+Ang II treatment increased H2O2 generation compared to individual treatment with HUA or Ang II (#p < 0.05 compared to the HUA group; △p < 0.05 compared to the Ang II group). (c) The HUA, Ang II, and HUA+Ang II groups showed remarkably higher O2·- production than the control group (∗p < 0.05), and HUA+Ang II treatment increased O2·- generation compared to individual treatment with HUA or Ang II (#p < 0.05 compared to the HUA group). (d) The 1O2 level was increased in the Ang II group (∗p < 0.05) and decreased in the HUA group compared to that in the control group (∗p < 0.05). The 1O2 level was lower in the HUA+Ang II group than that in the Ang II group (#p < 0.05); (e) the ·OH level was higher in the HUA, Ang II, and HUA+Ang II groups than that in the control group (∗p < 0.05) and was significantly higher in the HUA+Ang II group than that in the HUA and Ang II groups (#p < 0.01 compared to the HUA group; △p < 0.01 compared to the Ang II group). (f) The ONOO− level was higher in the HUA, Ang II, and HUA+Ang II groups than that in the control group (∗p < 0.05) and was significantly higher in the HUA+Ang II group compared to that in the HUA or Ang II group (#p < 0.01 compared to the HUA group; △p < 0.01 compared to the Ang II group).