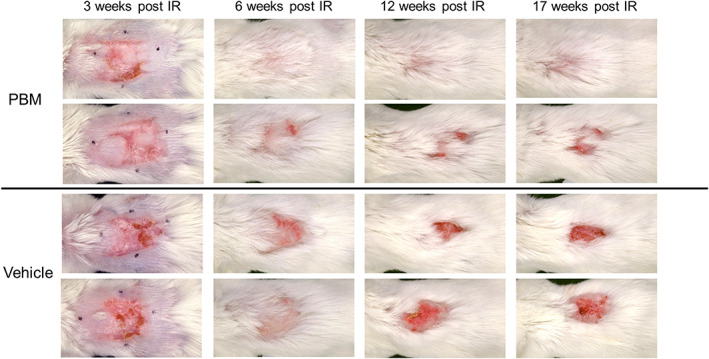
Figure 2.

Serial response of PBM and vehicle‐treated mice. The top two rows are examples of mice treated with topical PBM while the bottom two rows are examples of mice treated with vehicle alone. Each column represents a different time point including 3, 6, 12, and 17 weeks after irradiation. More complete healing with fewer recurrent ulcerations were observed in the PBM group compared to the vehicle group. The black marker dots seen at the 3 week time point indicate the area of irradiation on the dorsal surface of the mice. [Color figure can be viewed at wileyonlinelibrary.com]
