Figure 7.

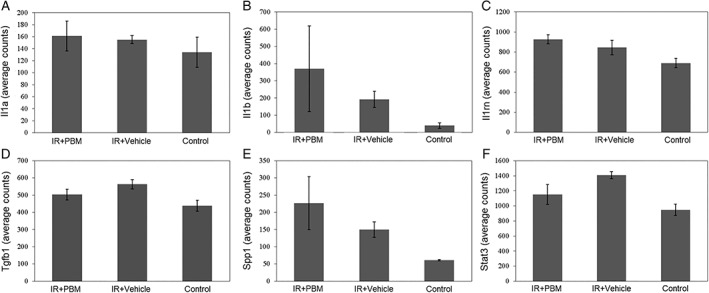
Chronic inflammatory and fibrosis gene expression analysis. Seventeen weeks postirradiation, the skin was harvested and RNA was extracted from the tissue for analysis. Each bar represents the mean ± SEM from skin samples of five mice.

Chronic inflammatory and fibrosis gene expression analysis. Seventeen weeks postirradiation, the skin was harvested and RNA was extracted from the tissue for analysis. Each bar represents the mean ± SEM from skin samples of five mice.