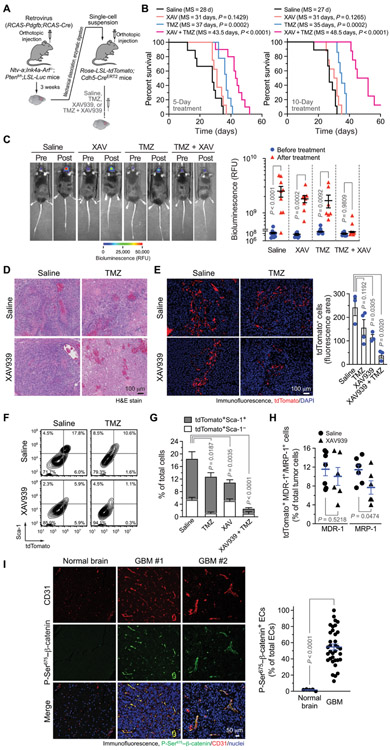
Fig. 7. Wnt inhibition abrogates EC stemness and sensitizes GBM and tumor-associated ECs to TMZ chemotherapy.
(A to H) GBM was induced by RCAS-mediated gene transfer in Ntv-a;Ink4a-Arf−/−;Ptenfl/fl;LSL-Luc mice. Single-cell tumor suspensions were injected into Rosa-LSL-tdTomato;Cdh5-CreERT2 mice. After tumor induction, the mice were treated with saline, TMZ, and/or XAV939. (A) Schematic approach. (B) Median Survival (MS) was monitored for 60 days. Left: Treatment with saline or TMZ (100 mg/kg) with or without XAV939 (40 mg/kg) for 5 days (n = 8 to 10). Right: Treatment with saline or TMZ (50 mg/kg) with or without XAV939 (40 mg/kg) for 10 days (n = 7 to 9). Statistical analysis by log-rank test. (C) Tumor volume was analyzed by bioluminescence imaging before and after 10-day treatment. Left: Representative images. Right: Bioluminescence values of mice before and after treatment (n = 7 to 9, means ± SEM). Statistical analysis by two-way ANOVA. RFU, relative fluorescence units. (D) Tumor sections were stained with hematoxylin and eosin (H&E) dyes. Representative images are shown (n = 5). (E) Tumor sections were stained with anti-tdTomato antibody, followed by immunofluorescence analysis. Left: Representative sortings. Right: Quantitative results (n = 3 to 4, means ± SEM). Statistical analysis by one-way ANOVA. (F and G) Single-cell tumor suspensions were stained with anti–Sca-1 and anti-tdTomato antibodies and analyzed by flow cytometry. (F) Representative sortings. (G) Quantitative results (n = 3 to 6, means ± SEM). Statistical analysis by one-way ANOVA for total tdTomato+ cells. (H) Single-cell tumor suspensions were stained with anti–MDR-1 and anti–MRP-1 antibodies and analyzed by flow cytometry (n = 6 to 7, means ± SEM). Statistical analysis by Student’s t test. (I) Tissue sections of surgical samples from human normal brain (n = 5) and from patients with GBM (n = 35) were probed with anti–P-Ser675–β-catenin and anti-CD31 antibodies, followed by immunofluorescence analysis. Left: Representative images. Right: Quantified results (means ± SEM). Statistical analysis by Student’s t test.

