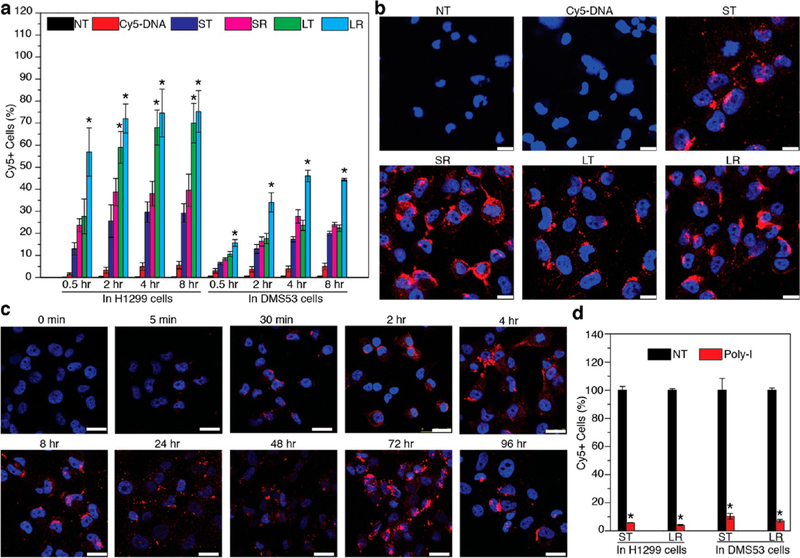
Figure 3.
Cellular uptake study of DONs in H1299 and DMS53 cells. (a) Flow cytometry analysis of the uptake of DONs into H1299 and DMS53 cells after 0.5, 2, 4, and 8 h. Nontreated (NT) and Cy5-DNA treated cells were included as negative controls. Each column represents the average percentage of cells with Cy-5 positive fluorescence from three independent experiments. Error bars represent standard deviations. *P < 0.05 compared with NT, Cy5-DNA, ST, and SR. (b) Representative confocal microscopy images of DONs in H1299 cells after 8 h of incubation. Strong Cy5 fluorescence in the cytoplasm was observed for cells treated with DONs but not NT and Cy5-DNA controls. Blue: DAPI, red: Cy5. Scale bars: 25 μm. (c) Time-course study of ST uptake into H1299 cells by confocal microscopy. ST was found inside cells at as early as 5 min. Enhanced accumulation of Cy-5 fluorescence in cells was observed with increasing incubation time up to 72 h. Fluorescence was decreased after 96 h of incubation. Scale bars: 25 μm. (d) Uptake of ST and LR in both cell lines with inhibition of scavenger receptors. Significant inhibition (90% reduction) of ST and LR uptake into both H1299 and DMS53 cells was observed for cells treated with Poly-I, which binds and saturates scavenger receptors to block their accessibility to DONs. Each column represents the average percentage of cells with Cy-5 positive fluorescence from three independent experiments. Error bars represent standard deviation. *P < 0.05 compared against NT.

