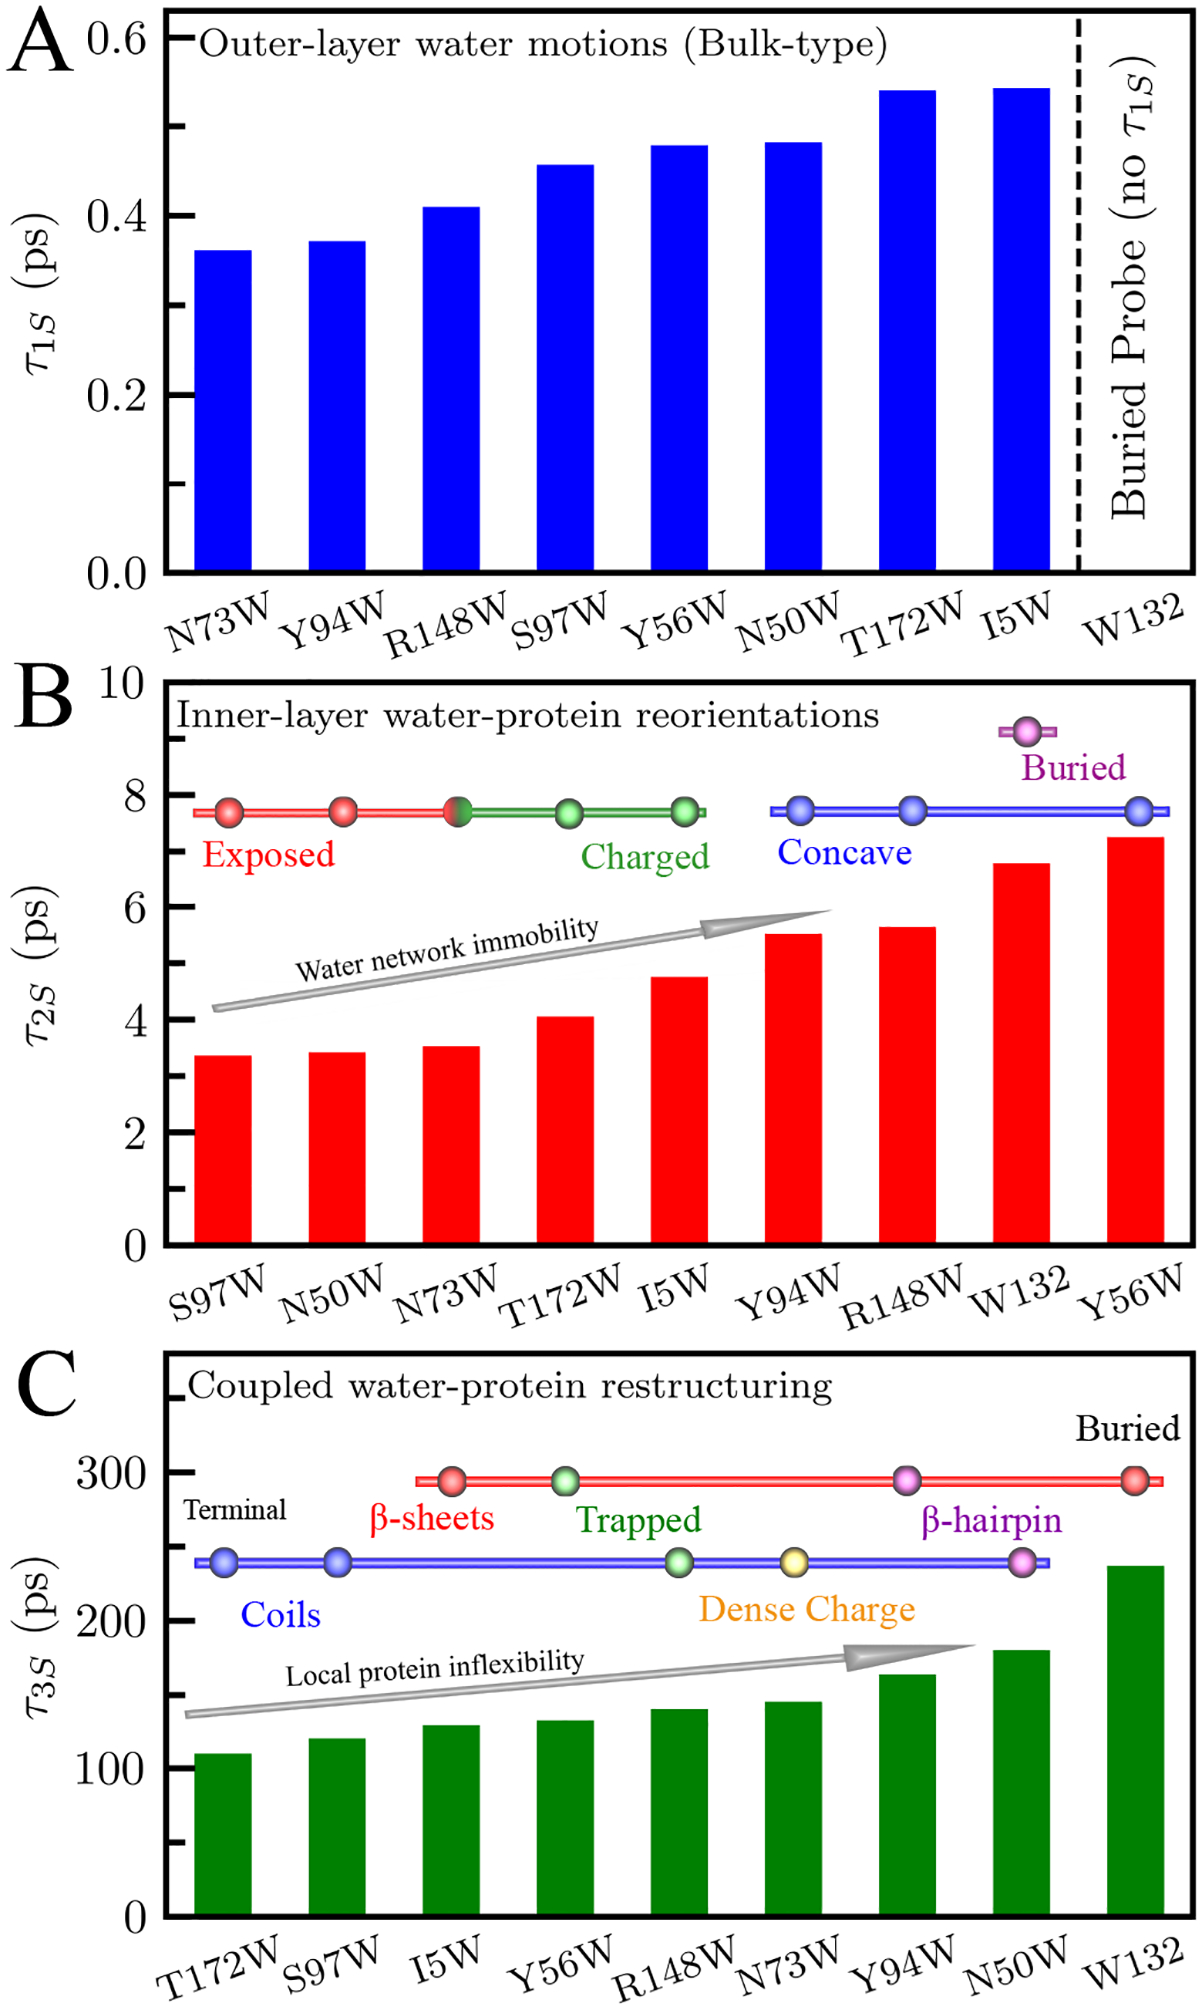
Figure 6.

Time scales of water relaxations τ1S (A), τ2S (B), and τ3S (C). τ1S is from outer-layers water motions and not detected by the buried mutant W132. In (B) the mutants are classified based on their local steric and chemical identities (solid red, exposed; green, charged; blue, concave; purple, buried). In (C) mutants are classified by secondary structures (blue bar, coils including loops and end terminal regions; red bar, β-sheet; purple, β-sheet), and local environment (yellow; dense charge, green; trapped).
