
Figure 1. Risk of a Medical Condition after the Diagnosis of a Mental Disorder, According to Category.
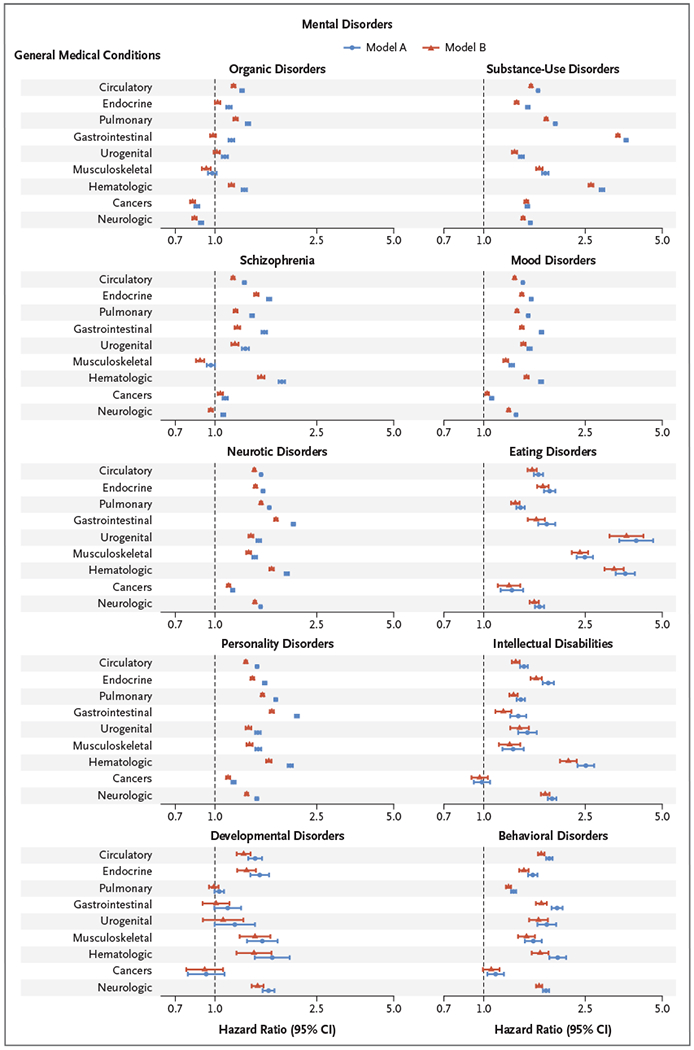
Each panel shows the pairwise risk of a medical condition (listed at the left of the graphs) after the diagnosis of a mental disorder (indicated at the top of each panel). Estimates were calculated with the use of Cox proportional-hazards models with age as the underlying time scale, after adjustment for sex and calendar time (model A) and after further adjustment for other mental disorders that had an onset before the mental disorder under study (model B). The line of unity is shown as a dashed line in each plot. Hazard ratios are shown on a log scale. I bars indicate confidence intervals.