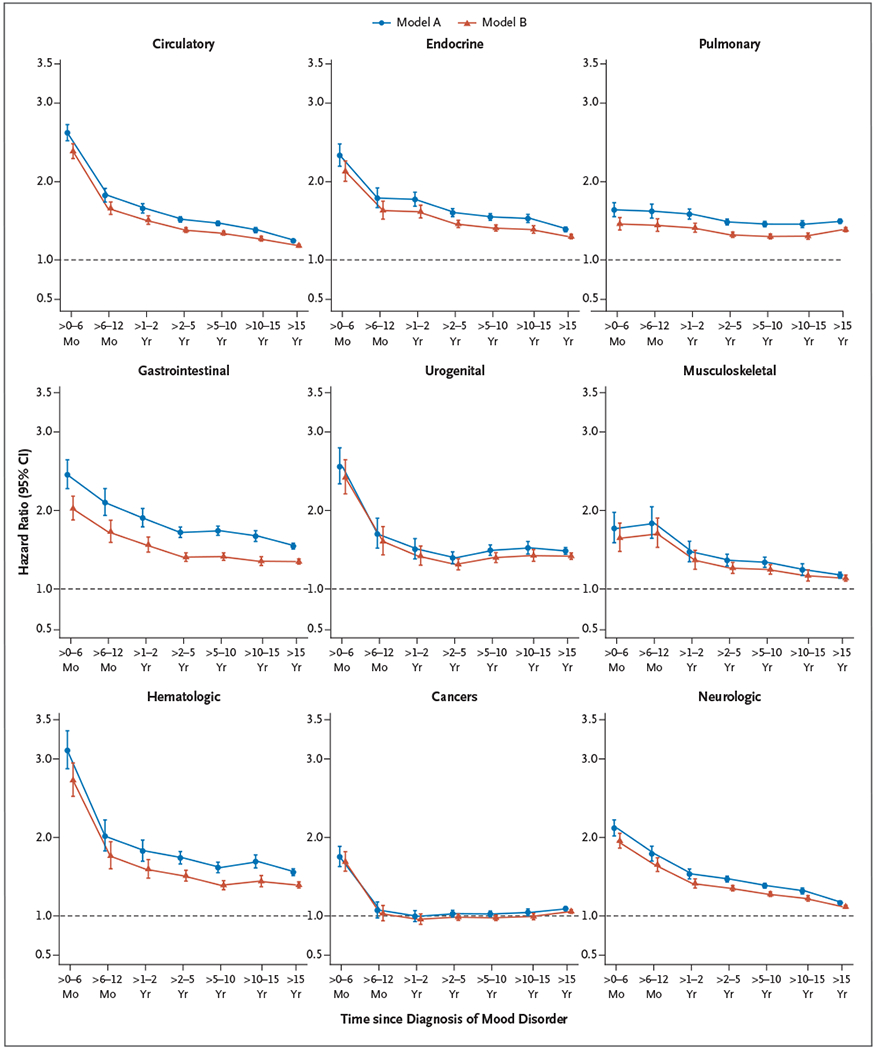
Figure 2. Risk of a Medical Condition after the Diagnosis of a Mood Disorder, According to the Timing of the Diagnosis.

Each panel shows the time-dependent hazard ratios for a medical condition after the diagnosis of a mood disorder, according to two models. Estimates were obtained with the use of Cox proportional-hazards models with age as the underlying time scale, after adjustment for sex and calendar time (model A) and after further adjustment for other mental disorders that had an onset before the mental disorder under study (model B). The line of unity is shown as a dashed line in each plot. The horizontal axes show the time period since the first diagnosis of a mood disorder. All other pairwise comparisons between mental disorders and medical conditions are shown in Figures S23 through S62.
