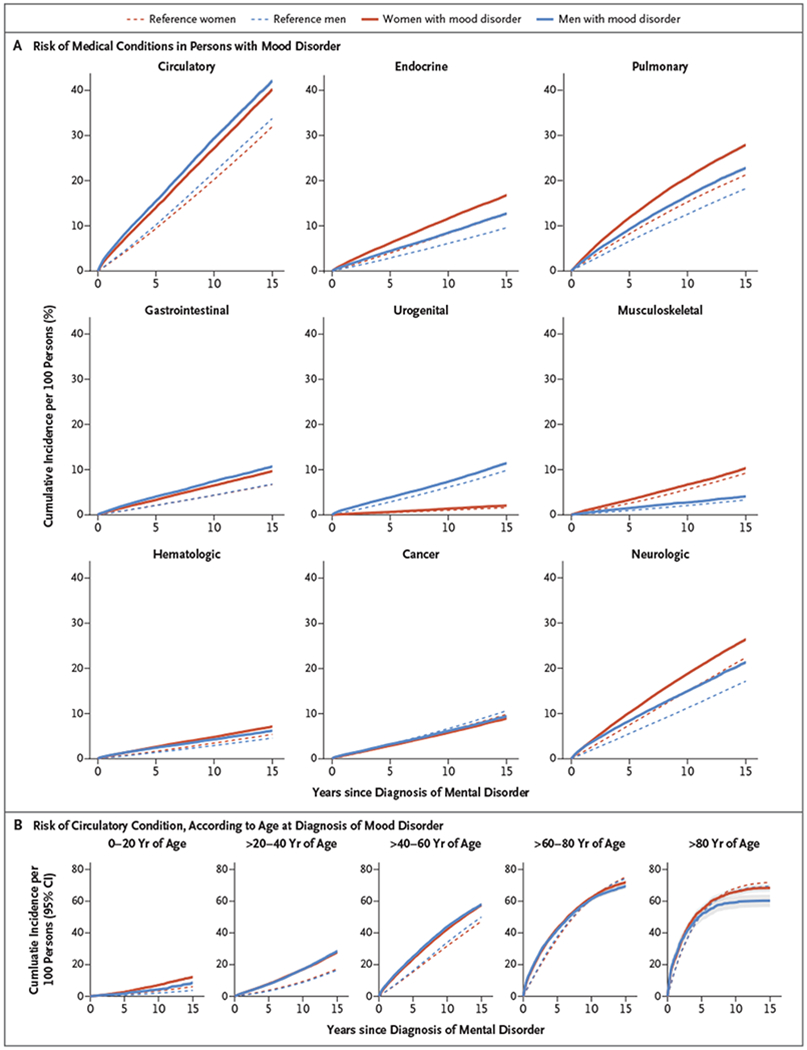
Figure 3. Risk of a Medical Condition after the Diagnosis of a Mood Disorder, According to Sex and the Time since the Diagnosis.

Shown is the risk (as measured by cumulative incidence per 100 persons) of a medical condition after the diagnosis of a mood disorder, according to sex and the category of medical condition. Panel A shows the estimates among all the persons in the study, according to the time since the diagnosis of the mood disorder. Panel B shows the risk of a circulatory condition according to the age at the time of the diagnosis of a mood disorder, with the time since the diagnosis of the mood disorder shown on the horizontal axes. The 95% confidence intervals (indicated by shaded gray areas around the curves) are so small that they are obscured by the estimate curves in Panel A and are visible only in the graph at the far right in Panel B. The absolute risks of all other pairs of mental disorders and medical conditions are shown in Figures S63 through S142.
