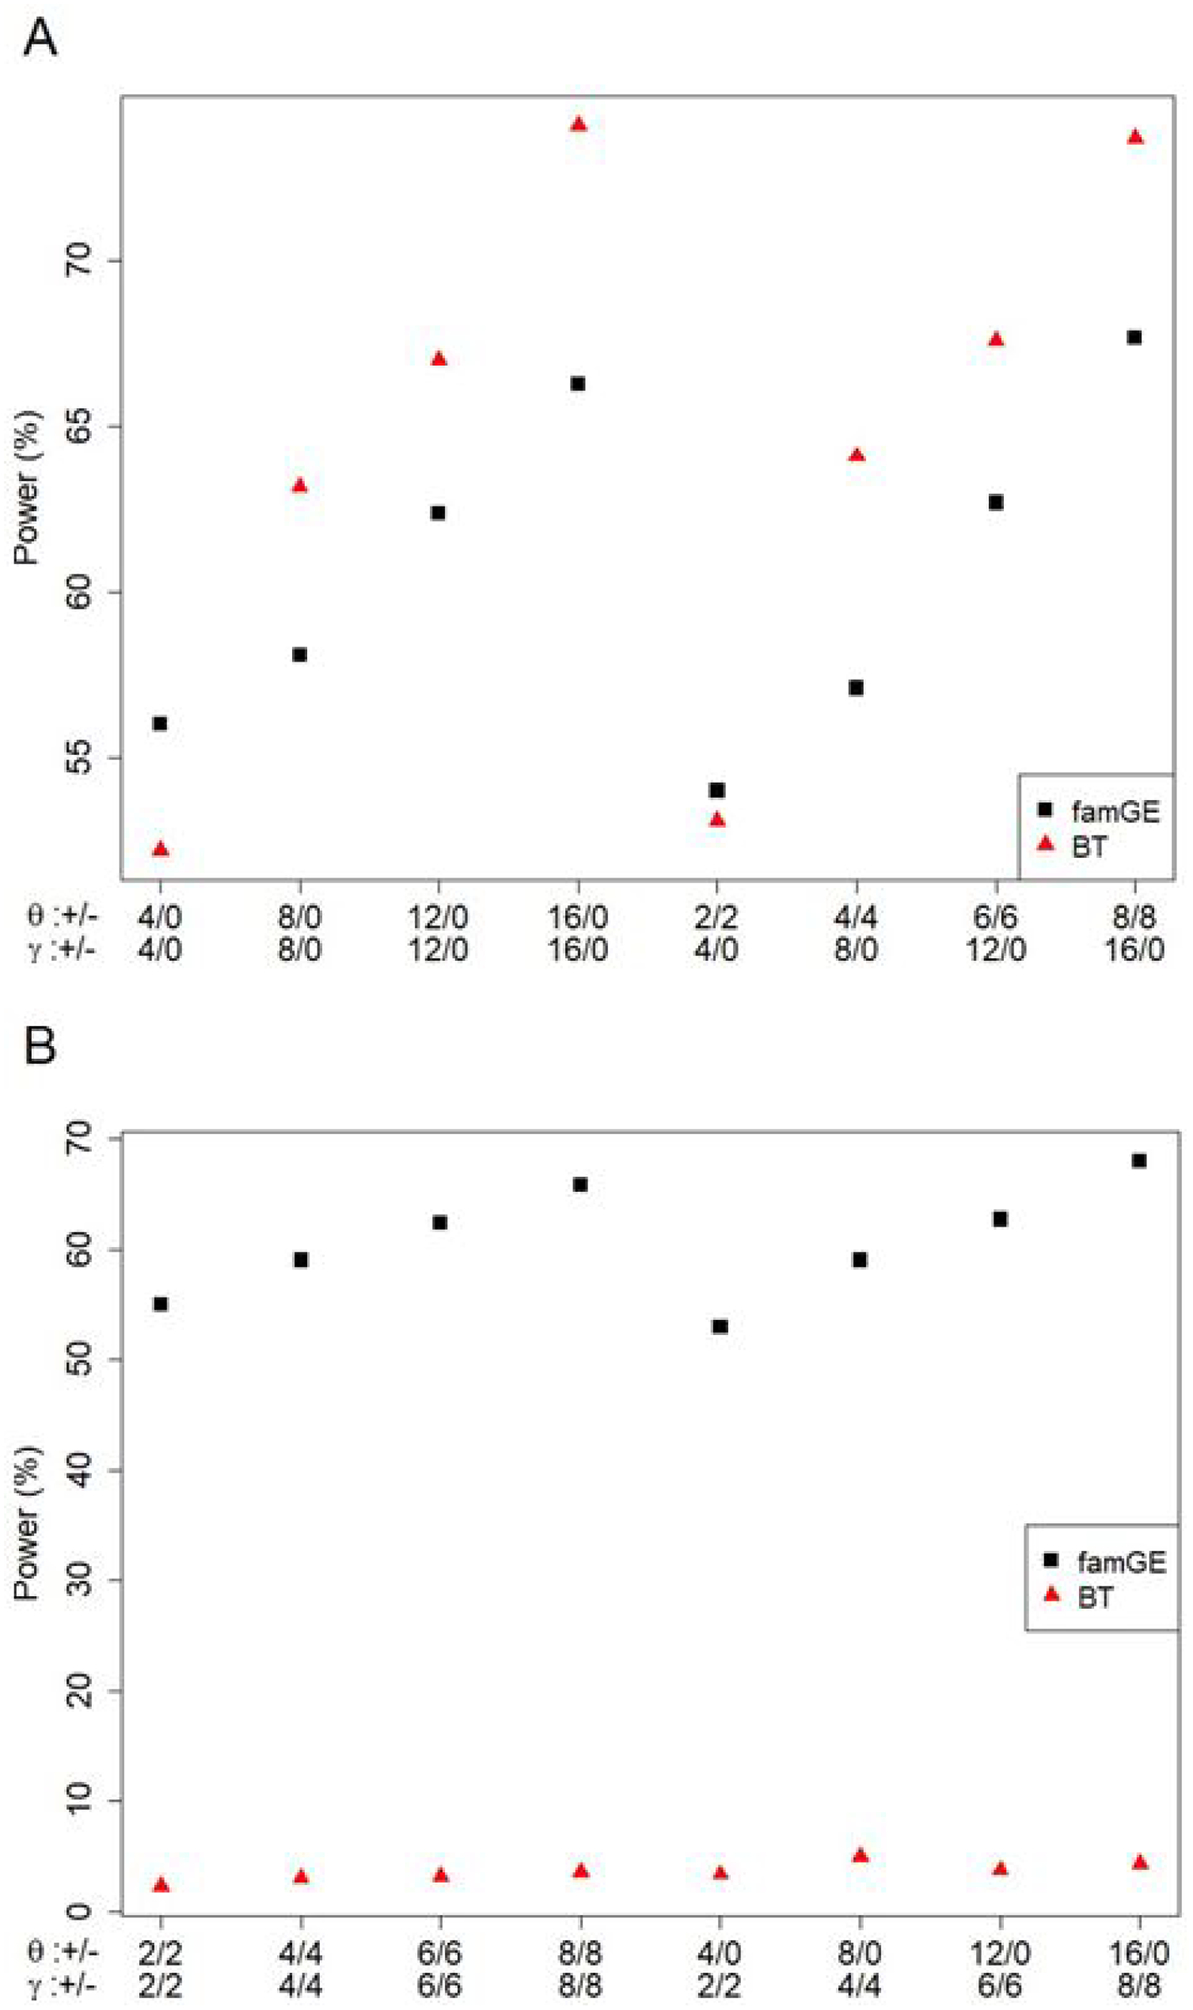
Figure 2. Power comparison of famGE and BT for binary trait.

The X-axis indicates different SNP scenarios and the y-axis presents power (%). For example, in the first scenario, there are 4 variants where the minor alleles have positive main effects (16 variants with no main effect), and 4 variants where the minor alleles have positive GE interaction effect (16 variants with no GE interaction effect).
(A) All positive interaction effects
(B) Minor alleles with both positive and negative interaction effects
+/− indicates the number of SNPs with positive and negative effects. θ denotes SNP main effects and γ denotes GE interaction effects
