
Figure 3.
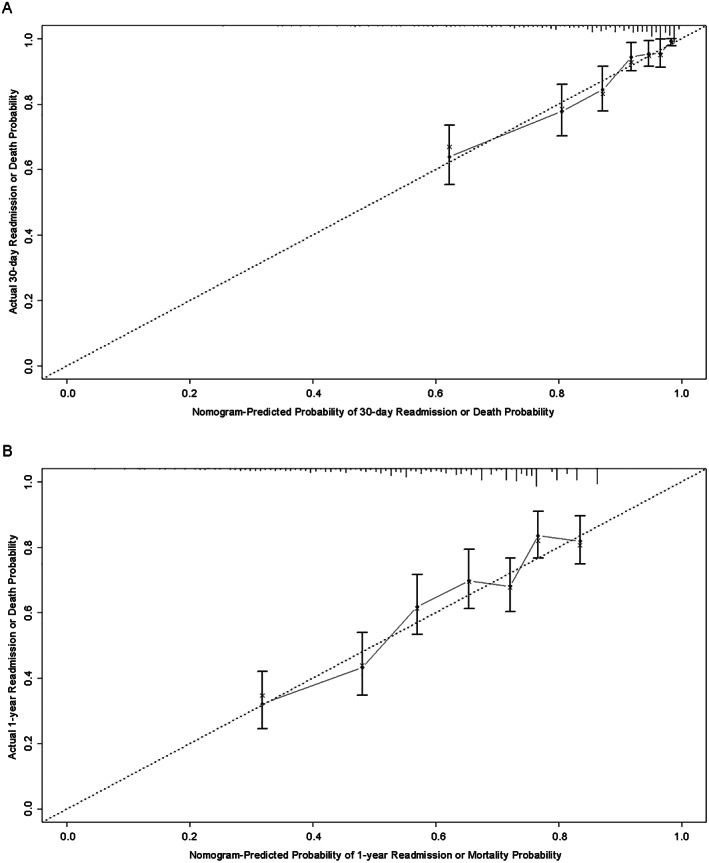
Validation of the nomogram for 30 day and 1 year all‐cause readmission. (A) Calibration plot of observed proportion versus predicted probability of 30 day readmission or death of the novel nomogram. (B) Calibration plot of observed proportion versus predicted probability of 1 year readmission or death of the novel nomogram.