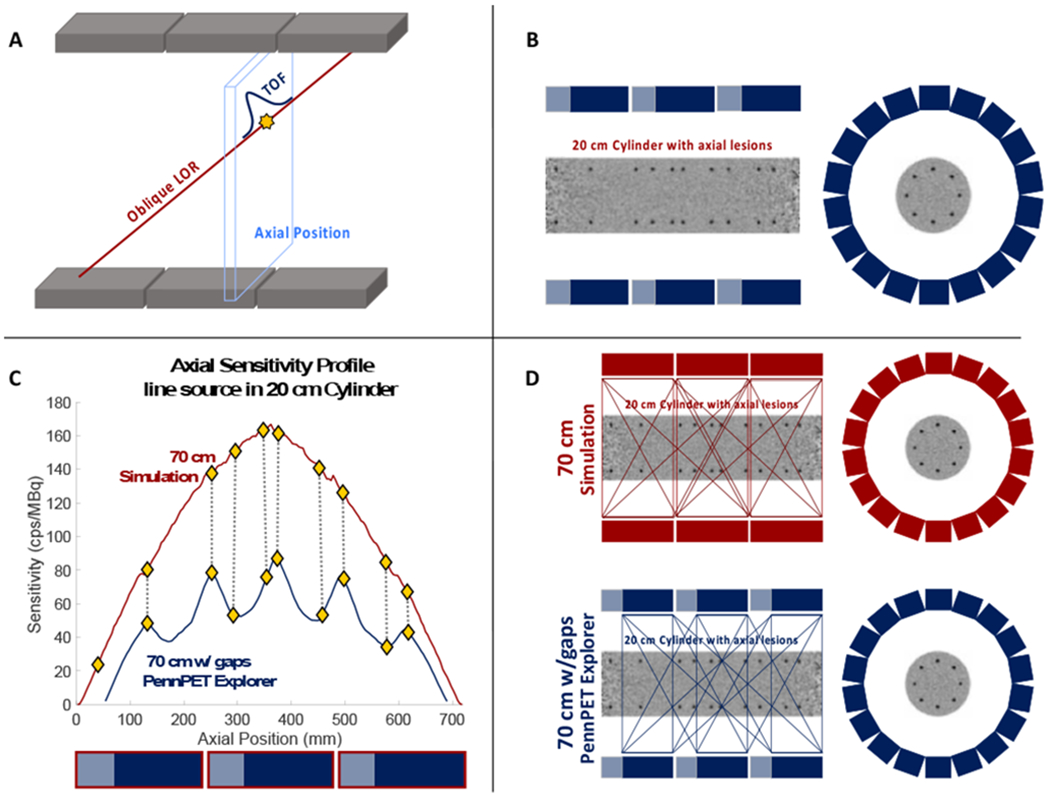
Figure 1.

(a) Schematic of the most likely positioning algorithm used to calculate the axial sensitivity for each axial location. Events are deposited into their corresponding axial position, based on the TOF difference of arrival of the two annihilation photons. (b) Schematic illustrating the axial placement of spheres with respect to the inactive regions in the PennPET Explorer. (c) Plot of the axial sensitivity profiles for both simulated and measured scanners along with the axial locations at which spheres were placed (diamonds). Shaded boxes below the plot indicate axial coverage of data active (blue) and inactive (gray) regions of the PennPET Explorer, while the red outlines indicate the axial coverage of the 70-cm simulated scanner. (d) Schematic of the simulated scanner and PennPET Explorer where shaded regions reflect axial LORs that pass through that region. The number of LORs that pass through any given axial location reflects the axial sensitivity at that location.
