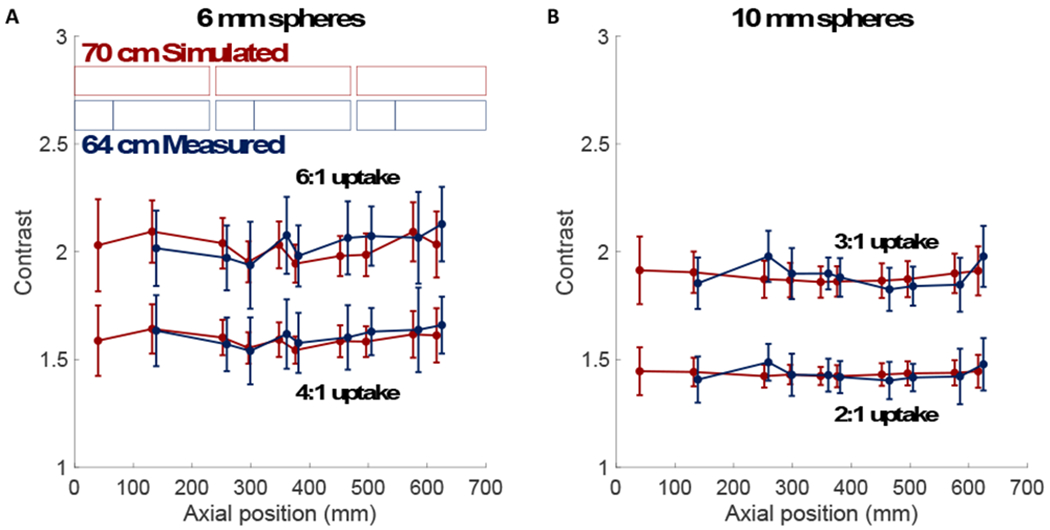
Figure 2.

Contrast vs. axial position for (a) 6-mm and (b) 10-mm spheres embedded in a 20-cm cylindrical phantom. (Top) Higher uptake and (bottom) lower uptake spheres are shown for both the simulation in red and measurement in blue. Scanner detector geometries for the 3 ring segments are shown in shaded boxes; simulation (red) and measurement (blue). The measurements cover 64 cm AFOV due to inter-ring data gaps indicated with lighter shading.
