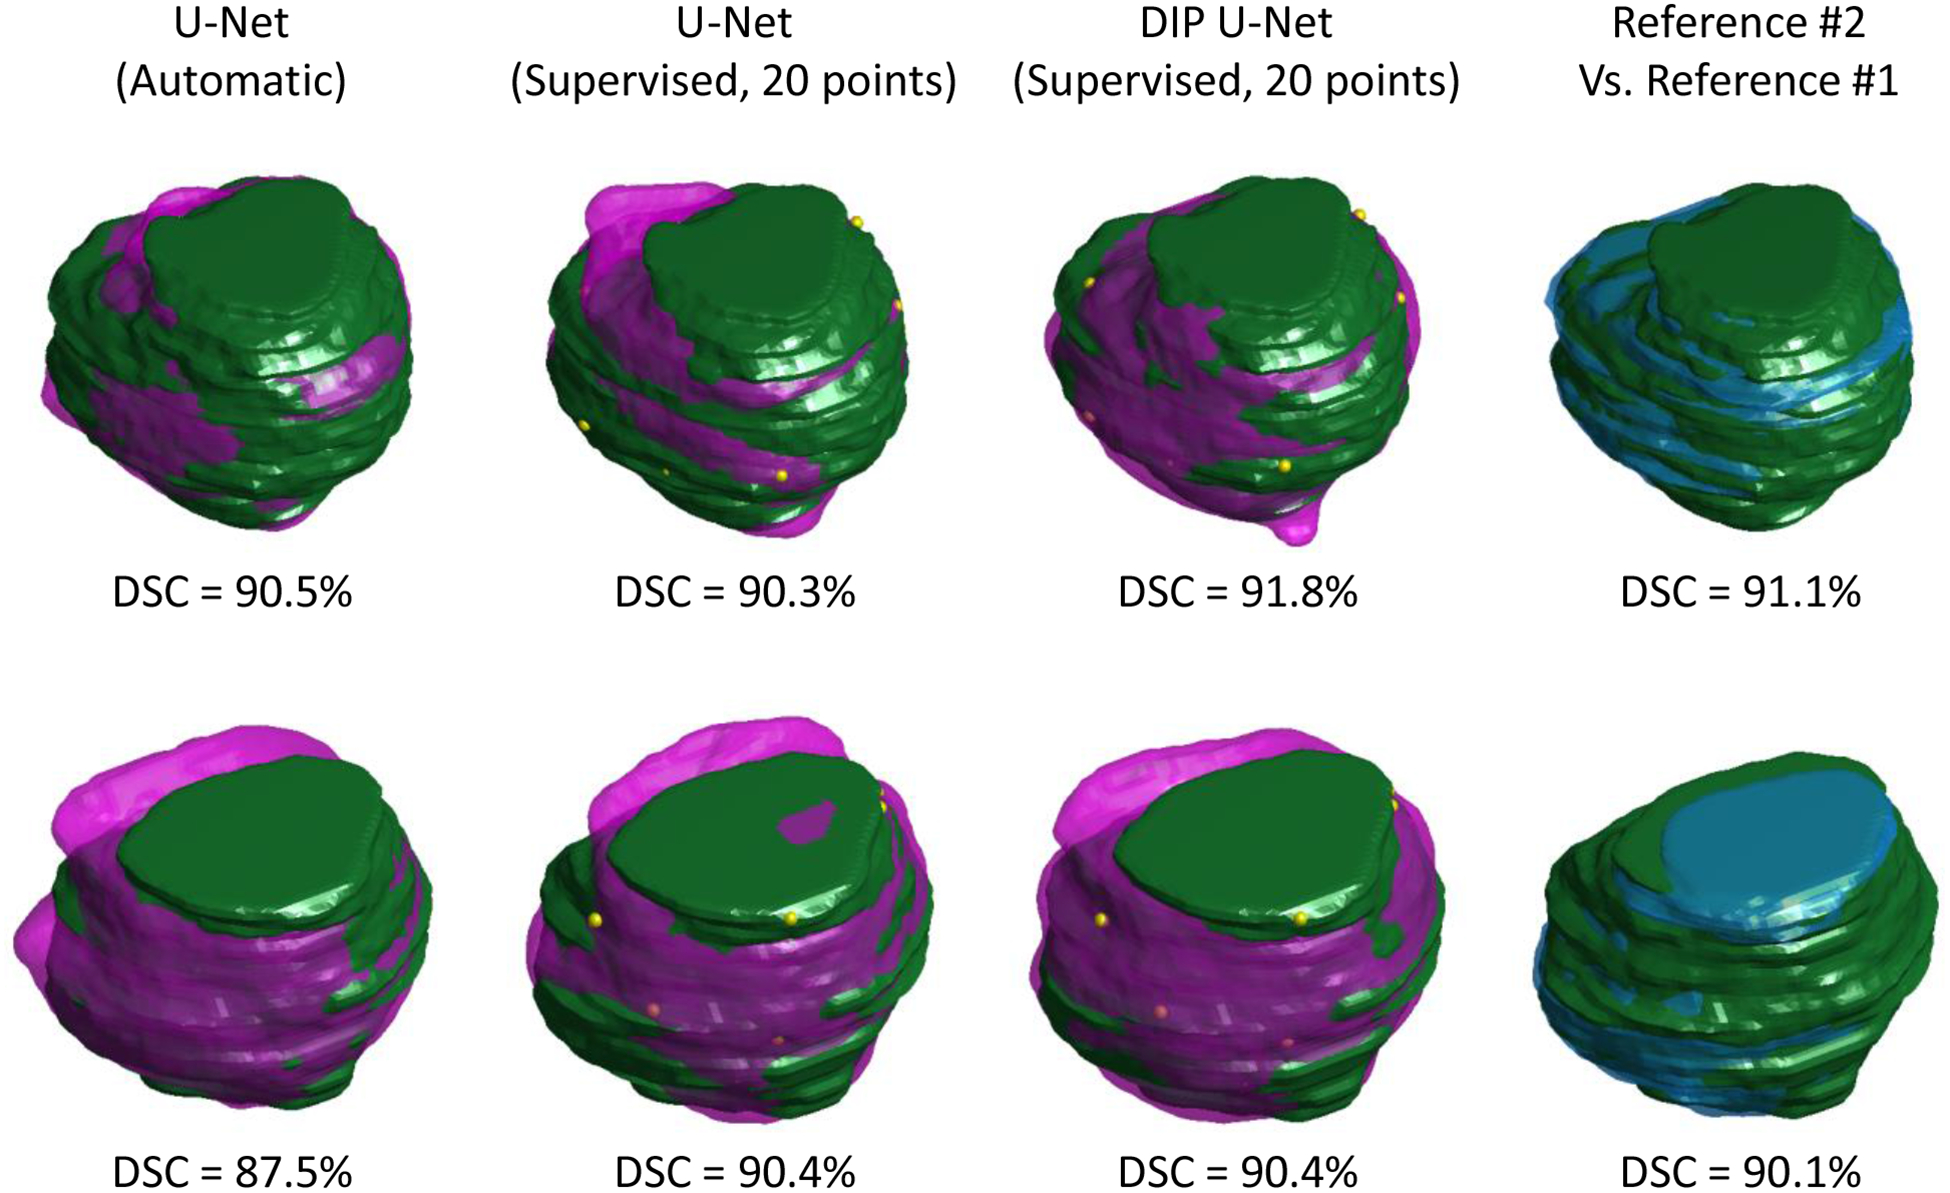
Figure 3.

Qualitative segmentation results for two test patients (semi-transparent, purple shapes) compared to manual segmentation reference #1 (green solid shapes). First column shows the automatic segmentation results using U-Net, the second and third column shows the supervised segmentation results using 20 selected surface points (shown with yellow dots) based on U-Net and DIP U-Net, respectively, and the last column compares the two manual segmentation labels.
