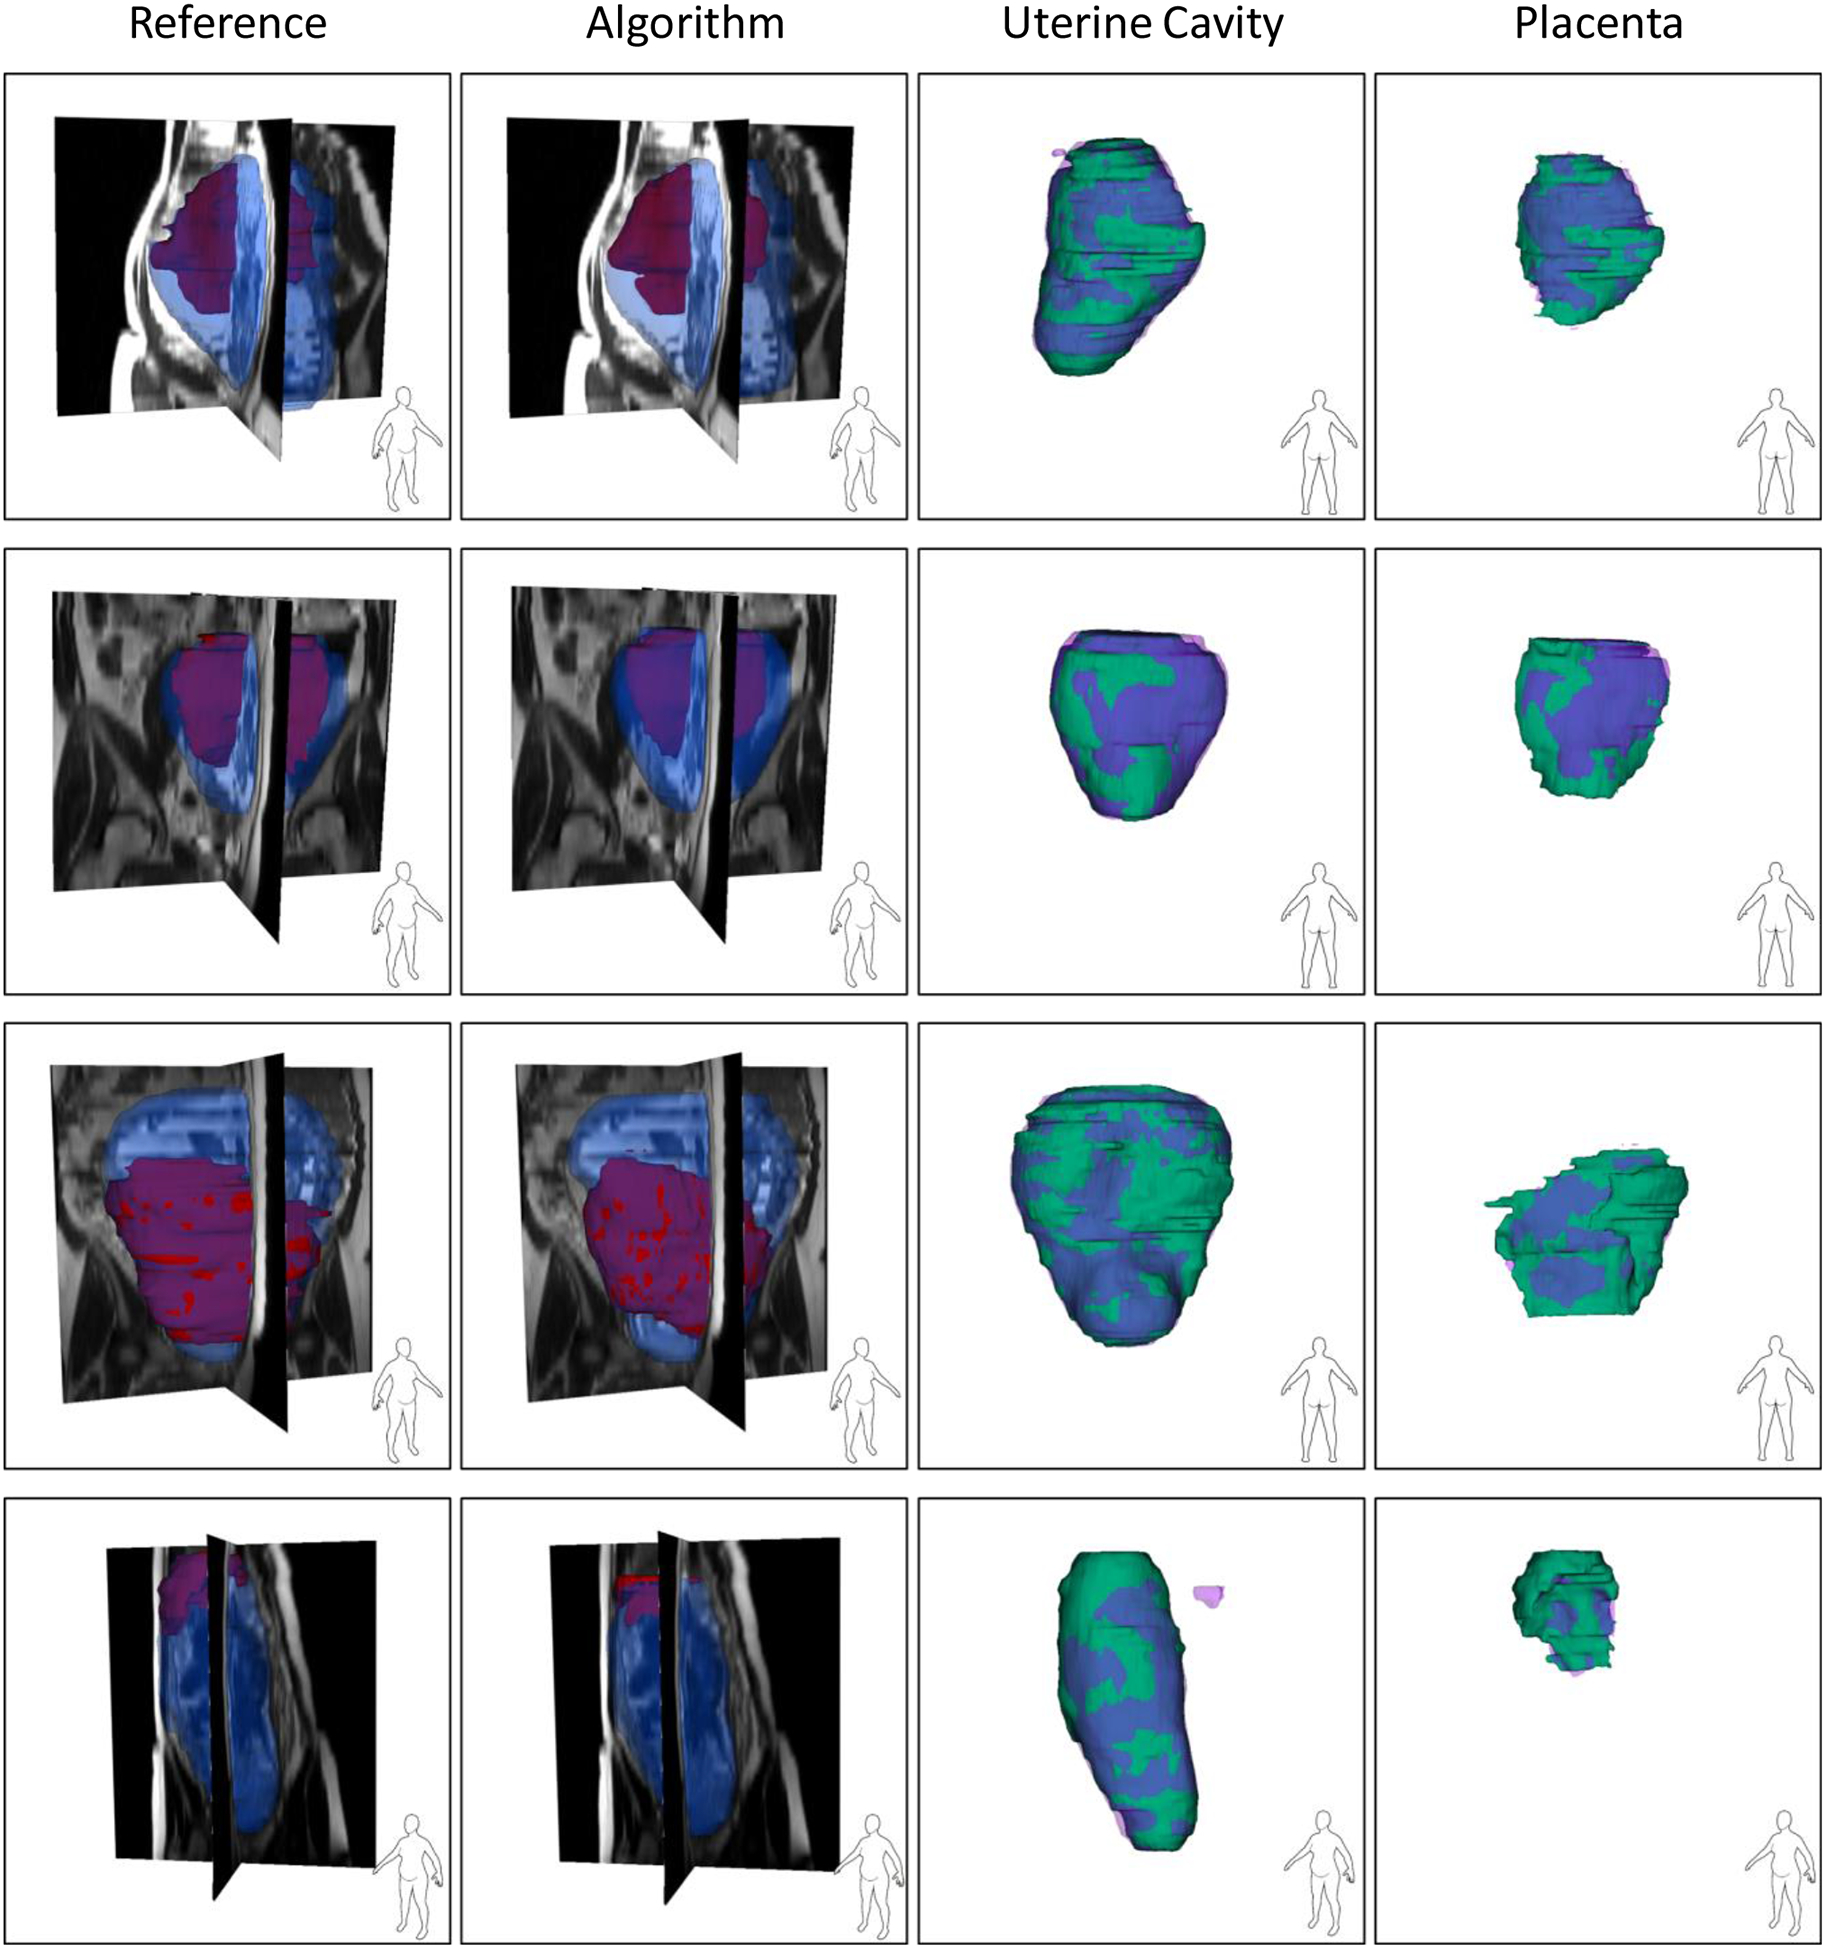
Figure 3.

Qualitative results of the uterus and placenta segmentation in 3D. Each row shows the results for one patient. For the first two columns, the blue, semi-transparent shapes show the uterine cavity and the solid, red shapes show the placenta. For the last two columns, the green, solid shapes show the manual segmentations and the semi-transparent, purple shapes show the algorithm segmentation results.
