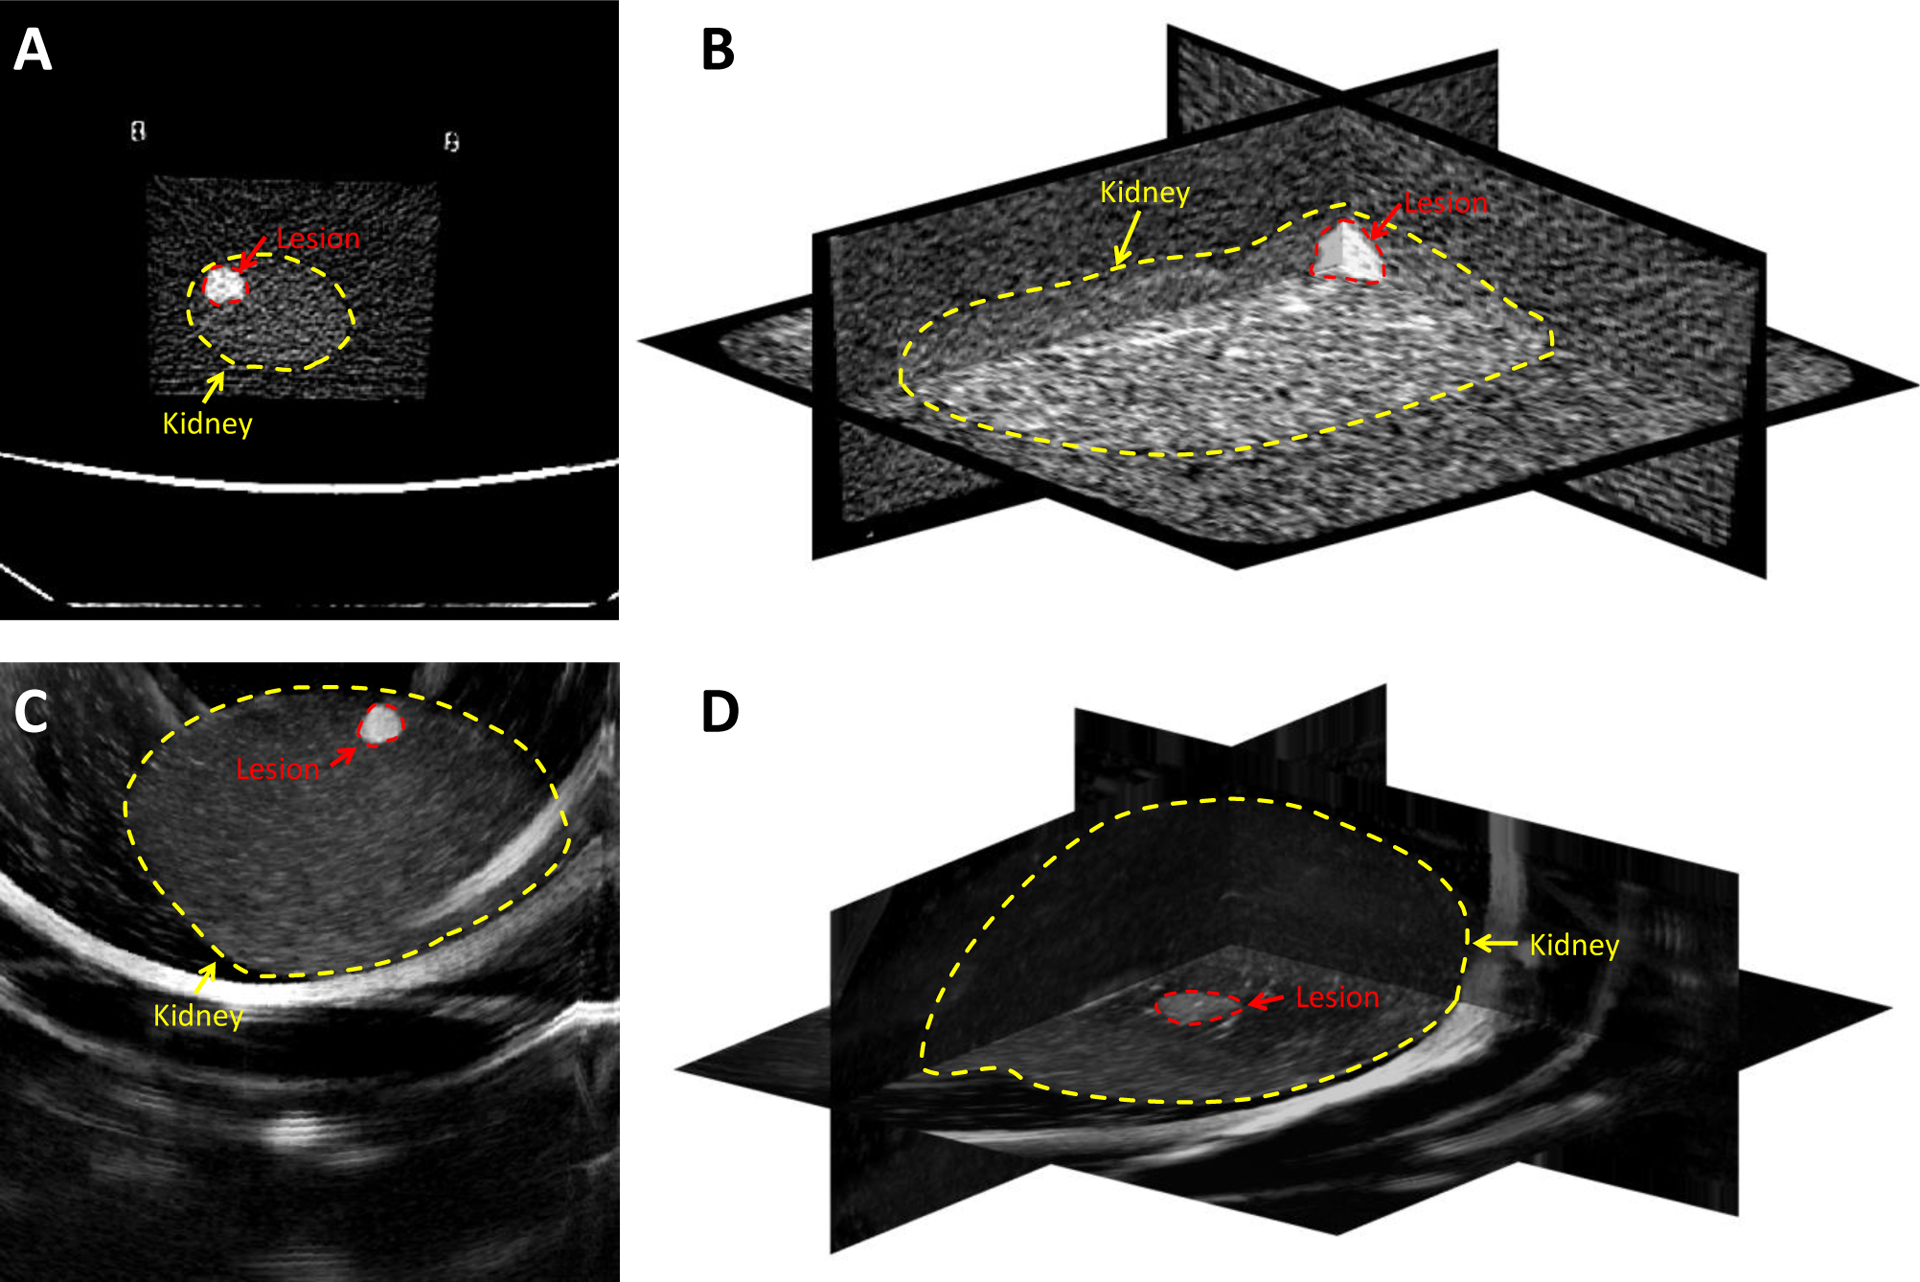
Figure 2.

CT and ultrasound imaging of a kidney phantom with visible lesions. A and B: CT images of the phantom, C: One sample 2D ultrasound slice of the kidney phantom, and D: The 3D ultrasound image volume constructed from captured 2D ultrasound images using a tracked transducer. The borders of the kidney and the lesion are displayed with dashed contours.
